Chaliotata Monthly Rainfall & Precipitation
This page shows both the average monthly rainfall and the number of rainy days in Chaliotata, Ionian Islands, Greece. These values are calculated using 30 years of data (1990–2020) to ensure accuracy. Now, let's break down all the details for a clearer picture.
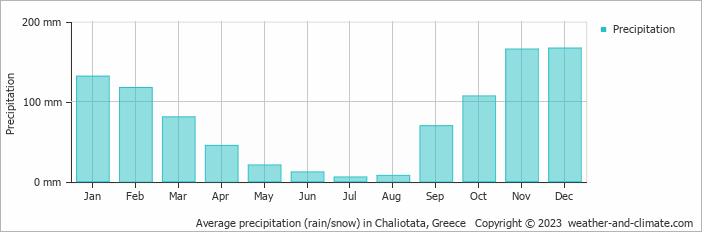
On average, Chaliotata receives a reasonable amount of rainfall, with an annual precipitation of 928 mm (37 in). Despite this overall moderate level, the city experiences distinct dry season during certain months throughout the year, as illustrated in the precipitation charts below.
Monthly Rainfall & Rainy Days
Monthly Precipitation Levels
The average number of days each month with precipitation (> 0.2 mm (0.01 in))
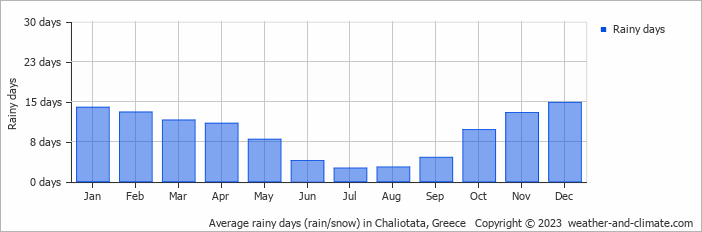
Chaliotata can be quite wet during December, receiving approximately 167 mm (6.6 in) of precipitation over 15 rainy days.
In contrast July, experiences much drier conditions, with 5.5 mm (0.2 in) of rainfall, spread across 3 rainy days.
December, the wettest month, has a maximum daytime temperature of 16°C (61°F). During the driest month July you can expect a temperature of 26°C (79°F). For more detailed insights into the city's temperatures, visit our Chaliotata Temperature page.
Annual Rainfall in Greece: City Comparison
The map below shows the annual precipitation across Greece. You can also select the different months in case you are interested in a specific month.
Chaliotata vs World: Rainfall Compared
Chaliotata's average annual precipitation is 928 mm (37 in). Let's compare this to some popular worldwide tourist destinations:
New York City, USA, receives 1276 mm (50 in) of rainfall annually, with precipitation evenly distributed throughout the year.
In Shanghai, China, the annual average precipitation is 1347 mm (53 in), with a humid subtropical climate.
Adelaide, Australia, enjoys 511 mm (20 in) of annual precipitation, with dry summers and wet winters.
Kuala Lumpur, Malaysia, receives 2529 mm (100 in) of annual rainfall, characteristic of its equatorial tropical rainforest climate, with consistent rainfall throughout the year and peak months during March and November.
Precipitation amounts are measured using specific gauges installed at weather stations, collecting both rain and snow and any other type of precipitation. Rainfall is measured directly in millimeters, while that from snow and ice is obtained by melting it. Automated systems often incorporate heaters to make this easier.
Information from these stations is transmitted via Wi-Fi, satellite, GPS, or telephone connections to central monitoring networks. This information is immediately updated and integrated into weather models and forecasts.
Precipitation has a very strong role in determining the local climate and ecosystem:
- Changing Rainfall Patterns: Global warming causes drastic changes in the patterns of rainfall. Some areas have been experiencing increased frequency and intensity of rainfall, while other areas experience longer dry spells or even droughts.
- Local Impacts: Many regions are experiencing heavier rainfall in the winter months and drier, hotter summers. This affects agriculture, water resources, and ecosystems.
- Mawsynram in India is noted as being the wettest place on earth, with over 11 meters (36 feet) of rain falling every year.
- In contrast, Antofagasta in Chile is among the driest places on the planet, getting less than 0.1mm (0.004 inches) per year, with some years recording virtually no rainfall.
- Nearly 1,650 thunderstorm cells are estimated over the planet at any given time.
For more detailed information about Chaliotata's weather, including sunshine hours, humidity levels, and temperature data, visit our Chaliotata Climate page.
Chaliotata Weather by Month
Pick a month to see the average temperature, rainfall and sunshine in Chaliotata - and find the best time to visit.
Chaliotata 3-Day Forecast
Temperature Rainfall
See the full Chaliotata climate overview or explore weather in Greece.
Popular this month
Where to go in July - average daytime high across popular destinations.
Bucket list
Need travel inspiration? Check out our bucket list articles and be inspired.
 Top 5 secluded beaches in Greece
Explore Greece's hidden gems: secluded beaches like Fokos, Seychelles, Potami, Kedrodasos, and Mouros for tranquil adventures away from crowds.
Discover Zakynthos
On the Greek island you can discover the rugged coastline, authentic old villages, a beautiful interior and the caves with the beautiful azure water.
Why Santorini should be on every Bucket List
This Greek island is home to some of the most stunning scenery globally, with its beautiful Caldera views, white-washed houses and crystal-clear waters.