Binningen Monthly Rainfall & Precipitation
This page shows both the average monthly rainfall and the number of rainy days in Binningen, Basel-Landschaft, Switzerland. Long-term data from 1990 to 2020 was used to calculate these averages. Let's explore the details to provide you with a complete overview.
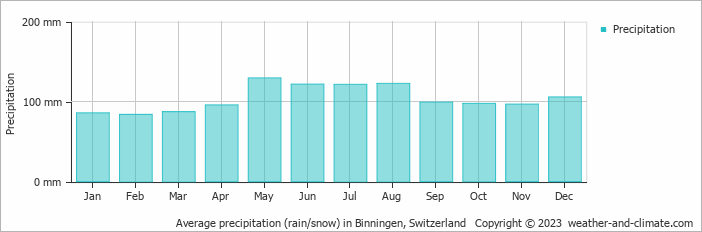
Binningen experiences significant rain/snowfall throughout the year, averaging 1245 mm (49 in) of precipitation annually.
Monthly Precipitation Levels
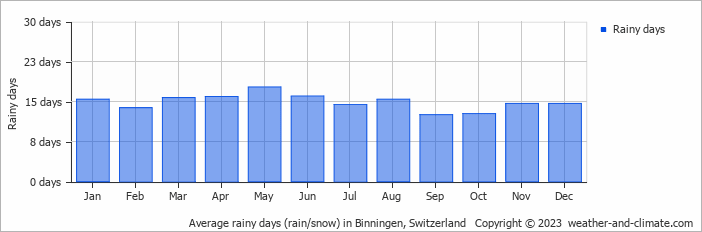
The average number of days each month with precipitation (> 0.2 mm (0.01 in))
The wettest period in Binningen occurs in May, which receives around 129 mm (5.1 in) of precipitation. During the driest month, February, Binningen experiences moderate rainfall, totaling approximately 84 mm (3.3 in). The consistent precipitation levels throughout the year contribute to a relatively stable climate.
May, the wettest month, has a maximum daytime temperature of 20°C (68°F). The city receives 188 hours of sunshine in this period. During the driest month February you can expect a temperature of 7°C (45°F). For more detailed insights into the city's temperatures, visit our Binningen Temperature page.
Annual Rainfall in Switzerland: City Comparison
The map below shows the annual precipitation across Switzerland. You can also select the different months in case you are interested in a specific month.
 heavy rainfall
 high
high
 moderate
 low
low
 almost none
Binningen vs World: Rainfall Compared
Binningen's average annual precipitation is 1245 mm (49 in). Let's compare this to some popular worldwide tourist destinations:
Chicago, USA, sees an annual precipitation of 1062 mm (42 in), with rain and snow contributing to its humid climate.
Beijing, China, receives 560 mm (22 in) of annual precipitation, concentrated in the summer months.
In Brisbane, Australia, the annual precipitation is 979 mm (39 in), making it wetter than Sydney.
Kuala Lumpur, Malaysia, receives 2529 mm (100 in) of annual rainfall, characteristic of its equatorial tropical rainforest climate, with consistent rainfall throughout the year and peak months during March and November.
Precipitation amounts are measured using specific gauges installed at weather stations, collecting both rain and snow and any other type of precipitation. Rainfall is measured directly in millimeters, while that from snow and ice is obtained by melting it. Automated systems often incorporate heaters to make this easier.
Information from these stations is transmitted via Wi-Fi, satellite, GPS, or telephone connections to central monitoring networks. This information is immediately updated and integrated into weather models and forecasts.
The proximity of a location to a large body of water can significantly affect its rainfall patterns:
- Ocean Influence: Coastal regions typically receive more rainfall due to the presence of moisture-laden winds from the ocean. These regions tend to have more humid climates and experience more frequent precipitation, especially in winter.
- Continental Climates: Areas further from the sea, such as inland or continental regions, experience less frequent rainfall and more extreme seasonal variations in precipitation.
- "Ginger" was the longest-lasting Atlantic tropical storm, which spun around the open ocean for 28 days in 1971.
- The world's largest snowflake was recorded in the Guinness Book of Records, at 38 cm (15 inches) wide and 20 cm (7.9 inches) thick. The snowflake fell at Fort Keogh, Montana, USA, on 28 January 1887.
- The greatest snowfall recorded was on Mt. Rainier, Washington State, USA—over 31.5 meters (103 feet) fell during the winter of 1972.
For more detailed information about Binningen's weather, including sunshine hours, humidity levels, and temperature data, visit our Binningen Climate page.