Beckenried Monthly Rainfall & Precipitation
This page shows both the average monthly rainfall and the number of rainy days in Beckenried, Canton of Lucerne, Switzerland. These averages rely on historical data collected over 30 years, from 1990 to 2020. Let's explore the details to provide you with a complete overview.
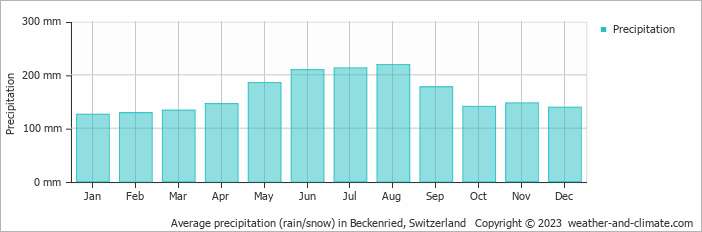
Beckenried has a relatively rain/snowy climate with high precipitation levels, averaging 1963 mm (77 in) of rain/snowfall annually. Despite the high annual total, it does experience a distinct rainy season during certain months. Examine our detailed charts below to understand these seasonal patterns.
Monthly Precipitation Levels
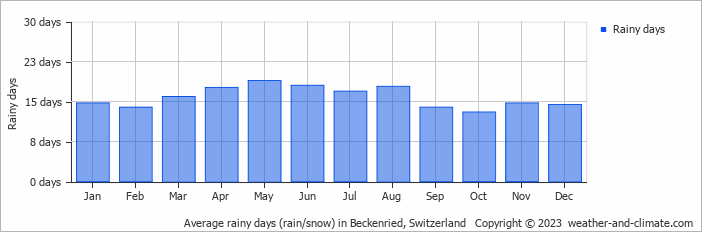
The average number of days each month with precipitation (> 0.2 mm (0.01 in))
Beckenried experiences moderate seasonal variation in rainfall, with monthly averages ranging from 219 mm (8.6 in) in August, the wettest month, and 126 mm (5 in) in January, the driest month.
August, the wettest month, has a maximum daytime temperature of 21°C (70°F). The city receives 158 hours of sunshine in this period. During the driest month January you can expect a temperature of 2°C (36°F). For more detailed insights into the city's temperatures, visit our Beckenried Temperature page.
Annual Rainfall in Switzerland: City Comparison
The map below shows the annual precipitation across Switzerland. You can also select the different months in case you are interested in a specific month.
 heavy rainfall
 high
high
 moderate
 low
low
 almost none
Beckenried vs World: Rainfall Compared
Beckenried's average annual precipitation is 1963 mm (77 in). Let's compare this to some popular worldwide tourist destinations:
New York City, USA, receives 1276 mm (50 in) of rainfall annually, with precipitation evenly distributed throughout the year.
Beijing, China, receives 560 mm (22 in) of annual precipitation, concentrated in the summer months.
In Brisbane, Australia, the annual precipitation is 979 mm (39 in), making it wetter than Sydney.
Mumbai, India, experiences a tropical monsoon climate with 1860 mm (73 in) of annual rainfall, with the majority of precipitation happening during the monsoon season from June to September.
Precipitation amounts are measured using specific gauges installed at weather stations, collecting both rain and snow and any other type of precipitation. Rainfall is measured directly in millimeters, while that from snow and ice is obtained by melting it. Automated systems often incorporate heaters to make this easier.
Information from these stations is transmitted via Wi-Fi, satellite, GPS, or telephone connections to central monitoring networks. This information is immediately updated and integrated into weather models and forecasts.
Precipitation has a very strong role in determining the local climate and ecosystem:
- Changing Rainfall Patterns: Global warming causes drastic changes in the patterns of rainfall. Some areas have been experiencing increased frequency and intensity of rainfall, while other areas experience longer dry spells or even droughts.
- Local Impacts: Many regions are experiencing heavier rainfall in the winter months and drier, hotter summers. This affects agriculture, water resources, and ecosystems.
- Mawsynram in India is noted as being the wettest place on earth, with over 11 meters (36 feet) of rain falling every year.
- In contrast, Antofagasta in Chile is among the driest places on the planet, getting less than 0.1mm (0.004 inches) per year, with some years recording virtually no rainfall.
- Nearly 1,650 thunderstorm cells are estimated over the planet at any given time.
For more detailed information about Beckenried's weather, including sunshine hours, humidity levels, and temperature data, visit our Beckenried Climate page.