Arinaga Monthly Rainfall & Precipitation
This page shows both the average monthly rainfall and the number of rainy days in Arinaga, Canary Islands, Spain. Long-term data from 1990 to 2020 was used to calculate these averages. Now, let's break down all the details for a clearer picture.
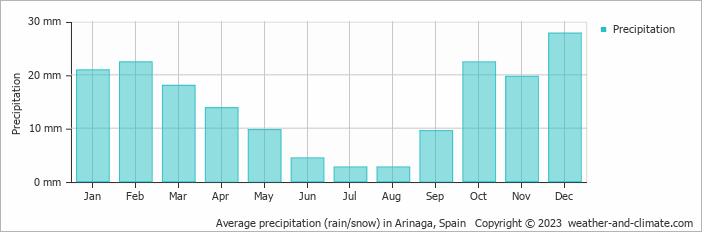
Arinaga sits in an arid zone with minimal moisture, averaging 174 mm (6.9 in) of rainfall per year.
Monthly Precipitation Levels
The average number of days each month with precipitation (> 0.2 mm (0.01 in))
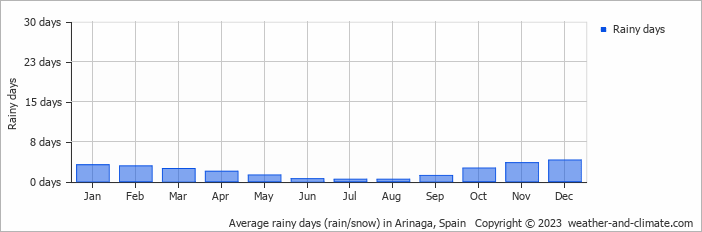
Significant seasonal changes in precipitation occur throughout the year. During the wettest month, December receives substantial rainfall, averaging 28 mm (1.1 in) of precipitation, recorded across 4 rainy days.
In contrast, the driest month, July brings less rainfall, with 2.7 mm (0.1 in) over 0 rainy days.
December, the wettest month, has a maximum daytime temperature of 21°C (70°F). The city receives 178 hours of sunshine in this period. During the driest month July you can expect a temperature of 24°C (75°F). For more detailed insights into the city's temperatures, visit our Arinaga Temperature page.
Annual Rainfall in Spain: City Comparison
The map below shows the annual precipitation across Spain. You can also select the different months in case you are interested in a specific month.
 heavy rainfall
 high
high
 moderate
 low
low
 almost none
Arinaga vs World: Rainfall Compared
Arinaga's average annual precipitation is 174 mm (6.9 in). Let's compare this to some popular worldwide tourist destinations:
New York City, USA, receives 1276 mm (50 in) of rainfall annually, with precipitation evenly distributed throughout the year.
Osaka, Japan, experiences 1507 mm (59 in) of rainfall annually, spread across the year with wetter summers.
In Brisbane, Australia, the annual precipitation is 979 mm (39 in), making it wetter than Sydney.
Bangkok, Thailand, experiences a tropical monsoon climate with 1668 mm (66 in) of annual rainfall, with the heaviest precipitation occurring during September and October.
Precipitation amounts are measured using specific gauges installed at weather stations, collecting both rain and snow and any other type of precipitation. Rainfall is measured directly in millimeters, while that from snow and ice is obtained by melting it. Automated systems often incorporate heaters to make this easier.
Information from these stations is transmitted via Wi-Fi, satellite, GPS, or telephone connections to central monitoring networks. This information is immediately updated and integrated into weather models and forecasts.
- Mawsynram in India is noted as being the wettest place on earth, with over 11 meters (36 feet) of rain falling every year.
- In contrast, Antofagasta in Chile is among the driest places on the planet, getting less than 0.1mm (0.004 inches) per year, with some years recording virtually no rainfall.
- Nearly 1,650 thunderstorm cells are estimated over the planet at any given time.
For more detailed information about Arinaga's weather, including sunshine hours, humidity levels, and temperature data, visit our Arinaga Climate page.


