Chitré Temperature by Month
The average annual maximum temperature in Chitré, Herrera, Panama is 32°C (90°F), with little variation between seasons. This page covers monthly averages, day-night differences, and how Chitré compares to cities worldwide.
Chitré Monthly Temperatures
The temperature in Chitré remains steady throughout the year, providing a consistently very warm climate. Maximum daytime temperatures range from a very warm 34°C (93°F) in April to a very warm 31°C (88°F) in November. Nights are mild year-round, with lows ranging from 25°C (77°F) in April to 23°C (73°F) in November.
The chart below illustrates the average maximum day and minimum night temperatures in Chitré by month:
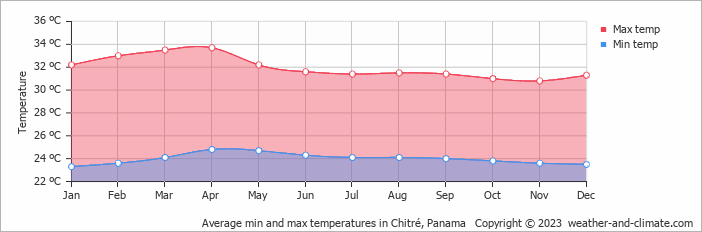
Temperatures tend to bottom out between 4 AM and 6 AM, then climb to their daily peak around 3 PM.
The chart below shows the average temperature throughout the year:
Temperature: Chitré vs Panama
The map below shows the annual temperature across Panama. You can also select individual months if you want to compare a specific time of year.
Chitré vs World: Temperature Compared
Chitré's average annual maximum temperature is 32°C (90°F). To put that in context, here's how it compares to a few well-known destinations:
Barcelona, Spain has an annual average of around 21°C (70°F), with warm summers and mild, fairly short winters.
Toronto, Canada averages 13°C (55°F) annually, with cold snowy winters balanced by genuinely warm summers.
San Francisco, USA averages 19°C (66°F) annually, but with little seasonal variation, summers are often cool and foggy, winters mild.
Melbourne, Australia averages 20°C (68°F) annually, known for unpredictable weather, with four seasons sometimes happening in one day.
Climate temperature data is typically calculated as a 30-year average. This smooths out year-to-year variability and gives a more reliable picture of what a place is actually like, rather than what happened in any single unusual year.
The readings come from a range of sources, land-based weather stations, ocean buoys, ships, and satellites. That data is collected by weather services around the world, then pooled, quality-checked, and averaged to produce the climate records you see here.
Seasonal temperature shifts influence more than just how warm it feels, they also drive changes in rainfall, cloud cover, and wind patterns throughout the year.
Warmer air holds more moisture, which tends to mean heavier or more frequent rain during the warmer months. When temperatures drop in winter, any precipitation that does fall is more likely to come as snow or sleet, though in Chitré this rarely lasts long on the ground.
For more on Chitré's weather, including monthly rainfall, sunshine hours, and humidity, visit our Chitré climate page.
Chitré Weather by Month
Pick a month to see the average temperature, rainfall and sunshine in Chitré - and find the best time to visit.
Chitré 3-Day Forecast
Temperature Rainfall
See the full Chitré climate overview or explore weather in Panama.
Popular this month
Where to go in July - average daytime high across popular destinations.
Bucket list
Need travel inspiration? Check out our bucket list articles and be inspired.
 Discover the San Blas Islands
The San Blas Islands are among the most beautiful islands in the Caribbean and perhaps even in the world. These tropical pearls are located in the north of Panama.
 The top 5 unexplored rainforests in Central America
Dive into Central America's top 5 hidden rainforests for an unparalleled journey through vibrant wildlife and diverse landscapes.