Chiavari Temperature by Month
Chiavari, Liguria, Italy has an average annual maximum temperature of 17°C (63°F), ranging from 10°C (50°F) in February to 26°C (79°F) in August. Below you'll find a full monthly breakdown and a comparison with cities worldwide.
Chiavari Monthly Temperatures
Depending on the time of the year, temperatures range from comfortable to cold in Chiavari. At night, minimum temperatures range from 21°C (70°F) in August to 6°C (43°F) in February.
The chart below illustrates the average maximum day and minimum night temperatures in Chiavari by month:
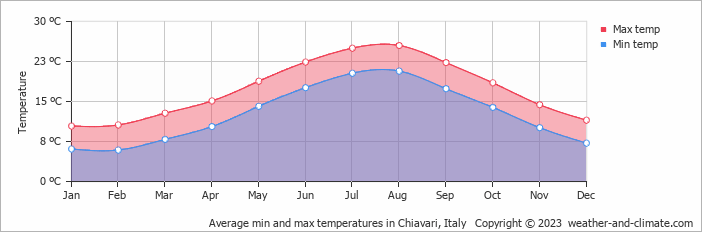
The minimum temperature is often recorded between 4 AM and 6 AM, while the highest temperature is usually reached at 3 PM, when the sun's heating effect is strongest. August, the warmest month, gets 267 hours of sunshine.
The chart below shows the average temperature throughout the year:
Temperature: Chiavari vs Italy
The map below shows the annual temperature across Italy. You can also select individual months if you want to compare a specific time of year.
 very warm
 warm
warm
 pleasant
 moderate
 cold
cold
 very cold
Chiavari vs World: Temperature Compared
Chiavari's average annual maximum temperature is 17°C (63°F). To put that in context, here's how it compares to a few well-known destinations:
Lisbon, Portugal averages 21°C (70°F) annually — warm summers, mild winters, and rain mainly in the cooler months.
Interlaken, Switzerland averages 8°C (46°F) a year, with cold winters and cool summers thanks to its Alpine setting.
Shanghai, China averages 21°C (70°F) a year, with warm summers, mild winters, and a noticeable spring and autumn.
Brisbane, Australia averages 26°C (79°F) a year, with warm winters and hot, humid summers.
What Does the Temperature Feel Like in Chiavari?
Temperature alone doesn't tell the whole story — humidity plays a big role in how warm or cold it actually feels. High humidity in summer makes the heat feel more intense, particularly once temperatures climb above 25°C. In winter, the same humidity can make cold air feel sharper than the thermometer suggests.
In the cooler months, when temperatures drop below 10°C, high humidity makes the cold feel more cutting than it would in dry conditions.
In Chiavari, February is the coolest month, with average highs of 11°C (52°F) and humidity around 63% — considered high. In August, the warmest month, temperatures average 26°C (79°F) with 66% humidity — conditions that feel high. For a full picture, see our humidity page.
Climate temperature data is typically calculated as a 30-year average. This smooths out year-to-year variability and gives a more reliable picture of what a place is actually like, rather than what happened in any single unusual year.
The readings come from a range of sources — land-based weather stations, ocean buoys, ships, and satellites. That data is collected by weather services around the world, then pooled, quality-checked, and averaged to produce the climate records you see here.
Whether a city sits on the coast or deep inland makes a significant difference to its climate. Coastal areas tend to have more stable temperatures year-round — large bodies of water absorb heat slowly in summer and release it gradually in winter, keeping extremes in check. Cities far from the sea don't benefit from that buffer, which is why continental climates tend to have hotter summers and colder winters than their coastal counterparts at the same latitude.
For more on Chiavari's weather — including monthly rainfall, sunshine hours, and humidity — visit our Chiavari climate page.


