Juigalpa Temperature by Month
The average annual maximum temperature in Juigalpa, Nicaragua is 31°C (88°F), with little variation between seasons. This page covers monthly averages, day-night differences, and how Juigalpa compares to cities worldwide.
Juigalpa Monthly Temperatures
The climate in Juigalpa remains fairly constant, offering very warm temperatures throughout the year. Maximum daytime temperatures reach a very warm 33°C (91°F) in April, dropping to a comfortable 30°C (86°F) in January. Nighttime lows stay between 24°C (75°F) and 22°C (72°F).
The chart below illustrates the average maximum day and minimum night temperatures in Juigalpa by month:
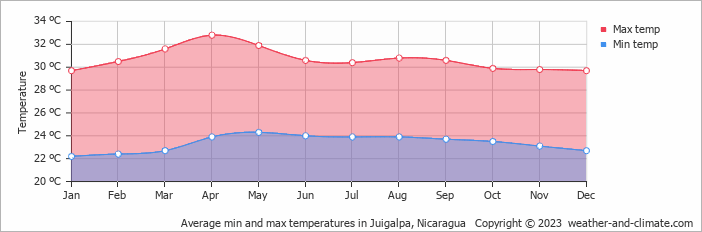
The minimum temperature is often recorded between 4 AM and 6 AM, while the highest temperature is usually reached at 3 PM, when the sun's heating effect is strongest. April, the warmest month, gets 226 hours of sunshine.
The chart below shows the average temperature throughout the year:
Historical Juigalpa Temperatures: 1976-2026
Browse day-by-day temperature records for Juigalpa spanning 51 years. Select any month and year to see actual high and low temperatures recorded on each day.
Temperature: Juigalpa vs Nicaragua
The map below shows the annual temperature across Nicaragua. You can also select individual months if you want to compare a specific time of year.
 very warm
 warm
warm
 pleasant
 moderate
 cold
cold
 very cold
Juigalpa vs World: Temperature Compared
Juigalpa's average annual maximum temperature is 31°C (88°F). To put that in context, here's how it compares to a few well-known destinations:
Athens, Greece sits at 23°C (73°F) on average, with hot dry summers and mild winters characteristic of the Mediterranean.
Toronto, Canada averages 13°C (55°F) annually, with cold snowy winters balanced by genuinely warm summers.
Boston, USA averages 16°C (61°F) annually, with four distinct seasons and cold winters that rival northern Europe.
Brisbane, Australia averages 26°C (79°F) a year, with warm winters and hot, humid summers.
Climate temperature data is typically calculated as a 30-year average. This smooths out year-to-year variability and gives a more reliable picture of what a place is actually like, rather than what happened in any single unusual year.
The readings come from a range of sources — land-based weather stations, ocean buoys, ships, and satellites. That data is collected by weather services around the world, then pooled, quality-checked, and averaged to produce the climate records you see here.
Global average temperatures have risen by around 1.2°C since the pre-industrial era, and the effects are visible across many regions. Winters are milder on average, with fewer frost days and less snow in many parts of the world. Heatwaves are more frequent and more intense, and Europe's summers of 2018, 2019, and 2020 all set records.
Summers are also getting drier in some areas, while winter rainfall has increased in others. This contributies to higher river levels and more flooding. In many countries, spring arrives earlier and autumn lasts longer. It has knock-on effects for wildlife, agriculture, and local ecosystems.
For more on Juigalpa's weather — including monthly rainfall, sunshine hours, and humidity — visit our Juigalpa climate page.