Rio Grande City (TX) Weather & Climate: Best Time to Visit
Average temperatures, rainfall, sunshine and the best time to visit Rio Grande City.
Climate overview of Rio Grande City
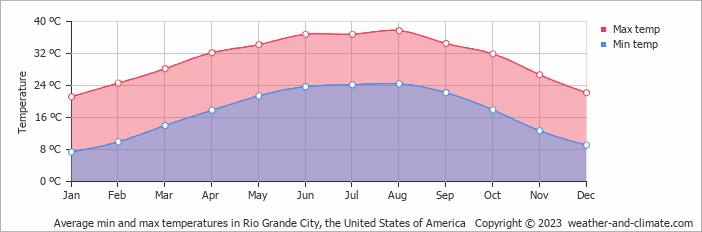
Temperatures in Rio Grande City, Texas, United States of America, vary greatly throughout the year. August is the hottest month at 38°C (100°F), while January is the coldest at 21°C (70°F).
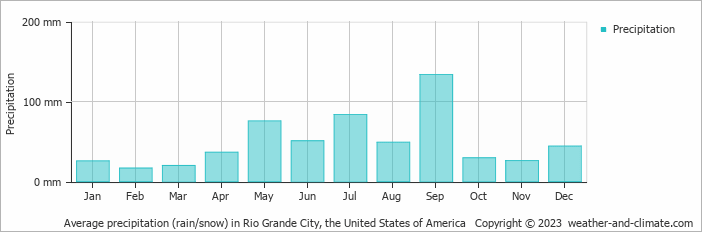
With around 590 mm (23 in) of annual rainfall, the city has moderate precipitation levels. September is the wettest month and February the driest. It also has two distinct dry seasons, January to April and October to November, with very hot summers and pleasant winters.
Rio Grande City Weather by Month
Pick a month to see the average temperature, rainfall and sunshine in Rio Grande City - and find the best time to visit.


Monthly Temperature in Rio Grande City
The climate in Rio Grande City is known for significant temperature differences throughout the year, making the weather dynamic. Typically, average maximum daytime temperatures range from a very hot 38°C (100°F) in August to a pleasant 21°C (70°F) in the coolest month, January.
Nights vary from 24°C (75°F) in August to around 7°C (45°F) during the colder months.
Check out our detailed temperature page for more information.
Temperature ranges by month
Rainfall in Rio Grande City
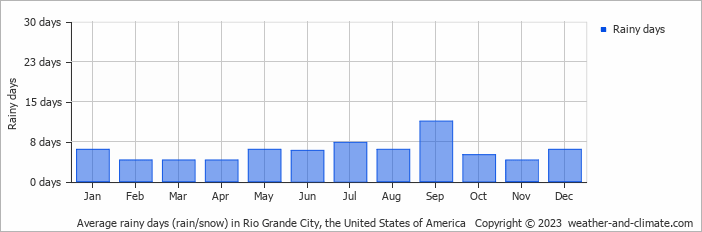
Generally, Rio Grande City receives mid-range precipitation levels, with 590 mm (23 in) annually. The climate in Rio Grande City shows significant variation throughout the year. Expect high rainfall in September, the wettest month, with an average of 134 mm (5.3 in) of precipitation over 11 rainy days.
In contrast, the driest month February offers drier and sunnier days, with around 17 mm (0.7 in) of rainfall over 4 rainy days. For more details, please visit our Rio Grande City Precipitation page.
The mean monthly precipitation over the year, including rain, hail, and snow
The average number of days each month with precipitation
Best Time to Visit Rio Grande City
Monthly ratings reflect general weather comfort, based on daytime temperature and rainfall. Swimming and winter conditions are highlighted separately where relevant.
- Best overall: January, February, March, November and December
- Warmest weather: June, July and August
- Wettest months: September, when rainfall is highest.
- Seasonal pattern: Two distinct dry seasons, January to April and October to November, with very hot summers and pleasant winters
Frequently asked questions about the climate in Rio Grande City
What is the best time to visit Rio Grande City?
January, February, March, November and December typically offer the most optimal weather in Rio Grande City. In contrast, May, June, July, August and September tend to have less optimal conditions. Rio Grande City has two distinct dry seasons, January to April and October to November, with very hot summers and pleasant winters.
What temperatures can I expect in Rio Grande City?
Daytime highs range from 21°C (70°F) in January to 38°C (100°F) in August. Nighttime lows range from 7°C (45°F) to 24°C (75°F). Temperatures vary considerably through the year.
How much rain does Rio Grande City get?
Annual rainfall is around 590 mm (23 in). September is the wettest month with 134 mm (5.3 in), while February is the driest with 17 mm (0.7 in).
Rio Grande City 3-Day Forecast
Rio Grande City on the map
Rio Grande City is highlighted - select any city to see its climate.
Popular this month
Where to go in September - average daytime high across popular destinations.

















Bucket list
Need travel inspiration? Check out our bucket list articles and be inspired.
 Yosemite National Park is definitely worth a visit
Vast forests, blue lakes, towering sequoias, and majestic waterfalls hint at the beauty of Yosemite National Park—a true natural masterpiece.
The 10 most alternative cities in the United States
Discover the top 10 fun and alternative U.S. cities rich in art, culture, and adventure. From Portland's hippy charm to Sedona's stunning landscapes.
Sedona: Explore Majestic Red Rock Landscapes
A picturesque artists' town surrounded by red rocks and known for its spirituality, vortex energy, and stunning hikes like Cathedral Rock.
10 most idyllic villages to visit in the United States
Discover 10 idyllic villages in the USA, from California to Vermont. Explore their unique charm, rich history, stunning nature, and vibrant arts scenes.