Grövelsjön Weather & Climate: Best Time to Visit
Average temperatures, rainfall, sunshine and the best time to visit Grövelsjön.
Climate overview of Grövelsjön
The climate in Grövelsjön, Dalarna, Sweden, is marked by large temperature swings across the seasons, ranging from 18°C (64°F) in July to -4°C (25°F) in February.
Annual rain/snowfall is moderate at around 753 mm (30 in), with July being the wettest month. The city also has a distinct dry season from February to March.
Grövelsjön Weather by Month
Pick a month to see the average temperature, rainfall and sunshine in Grövelsjön — and find the best time to visit.
Monthly Temperature in Grövelsjön
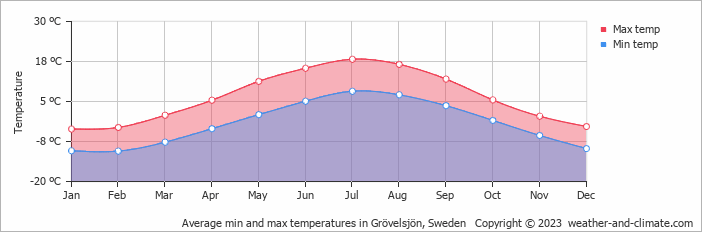
In Grövelsjön, temperatures differ significantly between summer and winter months. Average daytime temperatures reach a pleasant 18°C (64°F) in July. In February, the coolest month of the year, temperatures drop to a very cold -4°C (25°F).
At night, temperatures range from around 8°C (46°F) in July to -11°C (12°F) in February.
Check out our detailed temperature page for more information.
Temperature ranges by month
Rainfall in Grövelsjön
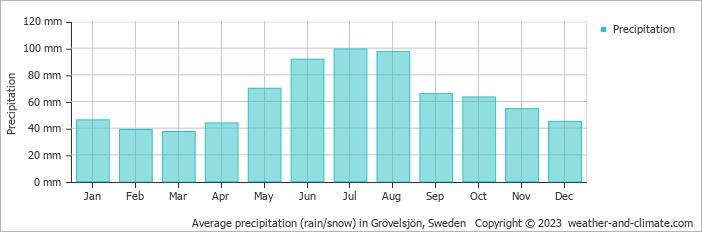
On average, Grövelsjön receives a reasonable amount of rain/snowfall, with an annual precipitation of 753 mm (30 in). Grövelsjön can be quite wet during July, receiving approximately 99 mm (3.9 in) of precipitation over 19 rainy days.
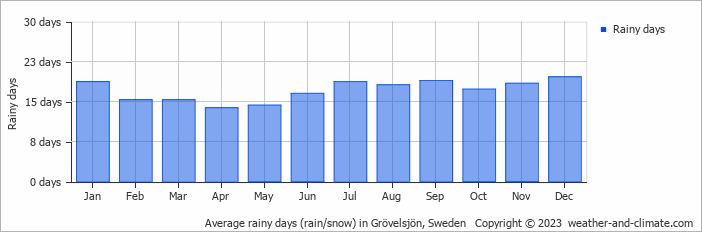
In contrast, during the driest month (March), you will experience much drier conditions, with 37 mm (1.5 in) of precipitation spread across 15 snowy days days. For more details, please visit our Grövelsjön Precipitation page.
The mean monthly precipitation over the year, including rain, hail, and snow
The average number of days each month with precipitation
Best Time to Visit Grövelsjön
Frequently asked questions about the climate in Grövelsjön
What is the best time to visit Grövelsjön?
July typically offers the most optimal weather in Grövelsjön. In contrast, January, February, March, April, October, November and December tend to have less optimal conditions. Grövelsjön has a distinct dry season from February to March.
What temperatures can I expect in Grövelsjön?
Daytime highs range from -4°C (25°F) in February to 18°C (64°F) in July. Nighttime lows range from -11°C (12°F) to 8°C (46°F). Temperatures vary considerably through the year.
How much rain does Grövelsjön get?
Annual rainfall is around 753 mm (30 in). July is the wettest month with 99 mm (3.9 in), while March is the driest with 37 mm (1.5 in).
Grövelsjön 3-Day Forecast
Grövelsjön 3-Day Forecast
Grövelsjön on the map
Grövelsjön is highlighted — select any city to see its climate.
Popular this month
Where to go in July — average daytime high across popular destinations.
Bucket list
Need travel inspiration? Check out our bucket list articles and be inspired.
 Stockholm is one of the most beautiful cities in the world
The Swedish capital is special because of the mix of culture, nature and city. It's a city that should be on everyone's bucket list.
Nordic skating in Sweden
In between the snowy hills and dense pine forests you will find an innumerable amount of lakes in Sweden, large and small ones on which you can skate wonderfully.
Sleep among the trees in Sweden
If you are looking for a tranquil retreat in Swedish Lapland we recommend to stay at Granó Beckasin. It has a fantastic location on the Ume river where you will experience silence and tranquility.
 See the northern lights
The northern lights, polar light or Aarora Borealis is a true spectacle of nature! Green, sometimes purple, red and yellow streaks of light colors the dark skies.