Garjia Weather & Climate: Best Time to Visit
Average temperatures, rainfall, sunshine and the best time to visit Garjia.
Climate overview of Garjia
Garjia, Uttarakhand, India, experiences significant temperature variation throughout the year. Summers bring daytime highs of 34°C (93°F) in May, while winters cool to 19°C (66°F) in January.
Rainfall is high, totalling around 1579 mm (62 in) per year. July is the wettest month and November the driest. The city also experiences distinct dry (October to April) and wet (June to September) seasons.
Garjia Weather by Month
Pick a month to see the average temperature, rainfall and sunshine in Garjia — and find the best time to visit.
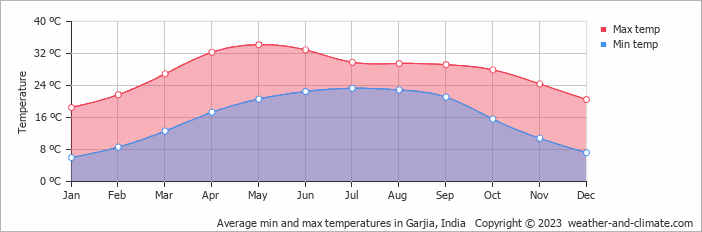
Monthly Temperature in Garjia
Depending on the time of the year, temperatures range from very warm to pleasant in Garjia. Average maximum daytime temperatures range from a very warm 34°C (93°F) in May, the warmest time of the year, to a pleasant 19°C (66°F) during cooler months like January.
At night, you can expect temperatures ranging from 23°C (73°F) in May to around 6°C (43°F) during January.
Check out our detailed temperature page for more information.
Temperature ranges by month
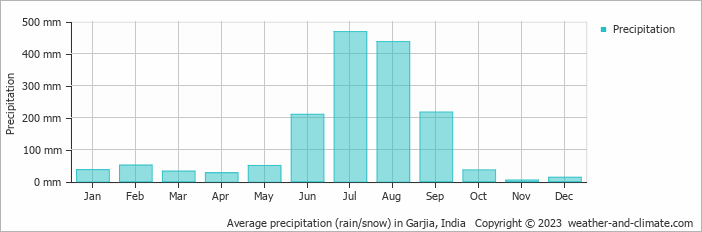
Rainfall in Garjia
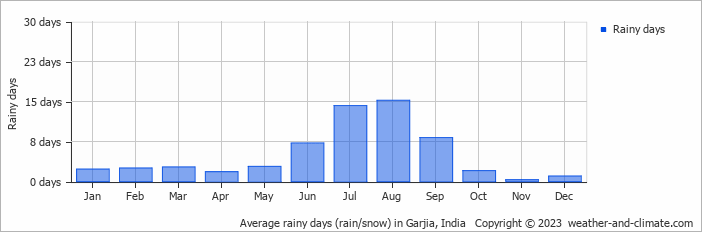
Garjia has a relatively rainy climate with high precipitation levels, averaging 1579 mm (62 in) of rainfall annually. Significant seasonal changes in precipitation occur throughout the year. In the wettest month, July it receives heavy rainfall, averaging 468 mm (18 in) of precipitation, recorded across 14 rainy days. In contrast, the driest month November brings less rainfall, with 4.2 mm (0.2 in) over 0 rainy days. For more details, please visit our Garjia Precipitation page.
The mean monthly precipitation over the year, including rain, hail, and snow
The average number of days each month with precipitation
Best Time to Visit Garjia
Rainfall during this time ranges from 4 mm (0.2 in) in November to 51 mm (2 in) in February. This means you can expect a mix of sunny days and occasional showers.
The rainy season falls during June, July, August and September, bringing heavy precipitation. Looking for inspiration on where to travel this year? We have a tool that recommends destinations based on your ideal conditions. Find out where to go with our weather planner.
Frequently asked questions about the climate in Garjia
What is the best time to visit Garjia?
February, March, October, November and December typically offer the most optimal weather in Garjia. In contrast, May, June, July and August tend to have less optimal conditions. Garjia has distinct dry (October to April) and wet (June to September) seasons.
What temperatures can I expect in Garjia?
Daytime highs range from 19°C (66°F) in January to 34°C (93°F) in May. Nighttime lows range from 6°C (43°F) to 23°C (73°F). Temperatures vary considerably through the year.
How much rain does Garjia get?
Annual rainfall is around 1579 mm (62 in). July is the wettest month with 468 mm (18 in), while November is the driest with 4.2 mm (0.2 in).
Garjia 3-Day Forecast
Garjia 3-Day Forecast
Garjia on the map
Garjia is highlighted — select any city to see its climate.
Popular this month
Where to go in July — average daytime high across popular destinations.
Bucket list
Need travel inspiration? Check out our bucket list articles and be inspired.
 A paradise called Andaman Islands
Though officially Indian, the Andamans are nearer Myanmar, Indonesia, and Thailand, resulting in amazing, budget-friendly white-sand beaches.
The 5 most beautiful monasteries in Ladakh
Explore Ladakh's spiritual essence through its incredible Buddhist monasteries. See architectural wonders, rich traditions, and serene landscapes in this guide.
Sleeping under the stars and riding camels in Rajasthan
A desert safari in Jaisalmer is definitely one of the highlights during a visit to India. Spending a night in the desert is a great adventurous bucket list experience.
Avoid mass tourism on an eco boat in the backwaters of Kerala
We can tell you now how you can avoid being surrounded by tourists and at the same time minimize your impact on the environment.