ClimateForecastAprilMay >>

Average monthly rainy days in Villarrica

The number of days each month with rain, snow and hail in Villarrica (Araucanía), Chile.

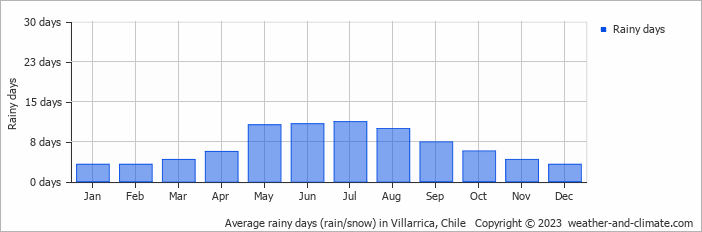
  • On average, July is the most rainy with 11 days of rain/snow.
  • On average, December is the driest month with 3 rainy days.
  • The average annual number of rainy days is 78.

Weather Forecasts for Villarrica

Tue   Apr 23
14°C | 6°C
NW 4 km/h
2 mm
partly cloudy and  chance of slight rain

partly cloudy and chance of slight rain

Wed   Apr 24
12°C | 4°C
NE 22 km/h
37 mm
overcast and heavy rain

overcast and heavy rain

Thu   Apr 25
13°C | 7°C
NW 22 km/h
44 mm
broken clouds and rain

broken clouds and rain

Interested in more climate information?

Weather and Climate provides you with all the information you need about the climate in Villarrica.

Our site offers climate and forecast data for every country in the world. Are you going to Chile? On this website you can find historical weather averages for many cities in Chile. Not sure yet where to go? We now have a tool which recommends destinations that suit your ideal climate conditions. Find out where to go with our weather planner.