Monthly Average Rainy days in Vallarga
The number of days each month with rain, snow and hail in Vallarga (), Italy.
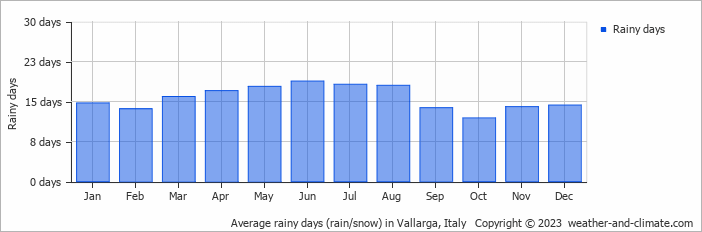
- Most rainy days are in March, April, May, June, July and August.
- On average, June is the most rainy with 18 days of rain/snow.
- On average, October is the driest month with 11 rainy days.
- The average annual number of rainy days is 188.
Current rainfall in Vallarga
Thu Nov 21
0°C | -6°C
SE  7 km/h
7 km/h18 mm
broken clouds and snow
Fri Nov 22
0°C | -10°C
NW 7 km/h
7 km/hpartly cloudy and no rain
Sat Nov 23
1°C | -11°C
N 7 km/h
7 km/hpartly cloudy and no rain


