Average Rainy - Precipitation days in Sharm El Sheikh
Over the course of the year, Sharm El Sheikh experiences 14 mm of rain across 5 days. On this page you will discover more about the number of precipitation days.
Monthly Distribution of Rainy Days
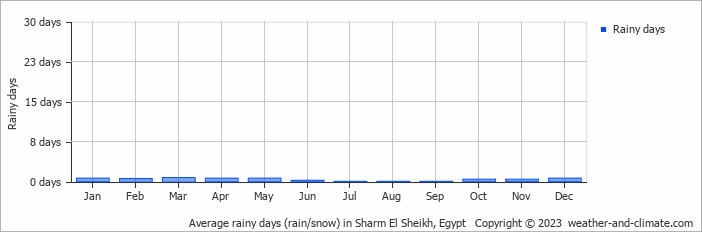
The wettest month is January, with a single rainy day bringing 3.7 mm of rain. In contrast, June sees 0 rainy days with 0 mm of rain.
Amsterdam Precipitation Days Compared World Wide
On average, Sharm El Sheikh receives over 5 days of precipitation annually. For comparison, here is some data from popular tourist destinations around the world:In Cairo, Egypt, there are only about 16 precipitation days annually, making it one of the driest capitals in the world.
In Bogotá, Colombia, there are around 188 precipitation days annually, typical for its high-altitude tropical climate.
Seville, Spain, experiences 103 precipitation days annually, with wet winters and dry summers typical of southern Spain.
Every year, the city of New York, USA, records about 130 precipitation days, with rainfall evenly distributed throughout the year.
Beijing, China, averages 72 precipitation days annually, concentrated in the summer months.
Adelaide, Australia, records about 86 precipitation days per year, with dry summers and wet winters.
Fun facts about Rain from Around the World
Here are some amazing facts about rain and precipitation worldwide:
- Cherrapunji, India, records an average of 322 rainy days each year. Despite this, the wettest place is Mount Waialeale in Hawaii with 11500 mm annual rainfall.
- The fastest recorded raindrop fell at 18 meters per second during a thunderstorm in Brazil.
- The Atacama Desert in Chile is so dry that some weather stations have never recorded rainfall since their installation.
- The largest recorded raindrop measured 8.8 mm in diameter during a tropical storm on La Réunion Island.
- Some clouds can weigh up to 500,000 tons, that's equivalent to the weight of 100 elephants.
For more detailed information about rainfall patterns in Sharm El Sheikh, visit our Rainfall & Precipitation page.
Current rainfall in Sharm El Sheikh