Monthly Average Rainy days in Punta Rucia
The number of days each month with rain, snow and hail in Punta Rucia (Puerto Plata Province), the Dominican Republic.
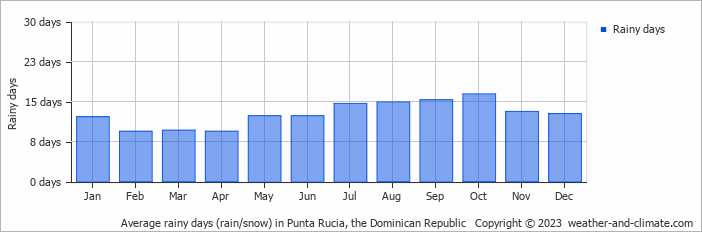
- Most rainy days are in September and October.
- On average, October is the most rainy with 16 days of rain/snow.
- On average, April is the driest month with 9 rainy days.
- The average annual number of rainy days is 152.
Current rainfall in Punta Rucia
Sun Jan 05
27°C | 20°C
E  7 m/s
7 m/s
7 m/sbroken clouds and no rain
Mon Jan 06
28°C | 20°C
E 6 m/s
6 m/s0.3 mm
partly cloudy and small chance of slight rain
Tue Jan 07
30°C | 20°C
NW 4 m/s
4 m/salmost clear and no rain