Average monthly rainy days in Llanquihue

The number of days each month with rain, snow and hail in Llanquihue (Los Lagos), Chile.

Average monthly rainy days in Llanquihue,

Feel free to add this climate graph to your website. Click the copy button above.

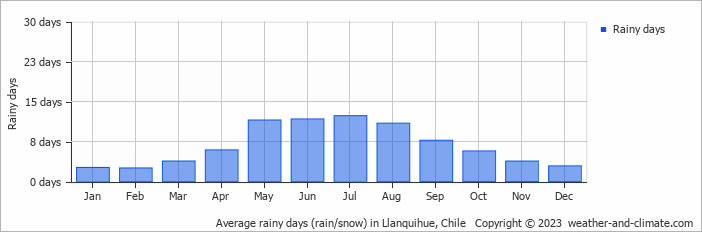
  • On average, July is the most rainy with 12 days of rain/snow.
  • On average, February is the driest month with 2 rainy days.
  • The average annual number of rainy days is 81.

Weather Forecasts for Llanquihue

Thu   Mar 28
21°C | 9°C
N 4 km/h
1.2 mm
partly cloudy and no rain

partly cloudy and no rain

Fri   Mar 29
17°C | 10°C
S 25 km/h
2.8 mm
partly cloudy and slight rain

partly cloudy and slight rain

Sat   Mar 30
14°C | 8°C
SW 18 km/h
broken clouds and no rain

broken clouds and no rain

Interested in more climate information?

Weather and Climate provides you with all the information you need about the climate in Llanquihue.

Our site offers climate and forecast data for every country in the world. Are you going to Chile? On this website you can find historical weather averages for many cities in Chile. Not sure yet where to go? We now have a tool which recommends destinations that suit your ideal climate conditions. Find out where to go with our weather planner.