Average monthly rainy days in Krivi Put
The number of days each month with rain, snow and hail in Krivi Put (Lika-Senj County), Croatia.
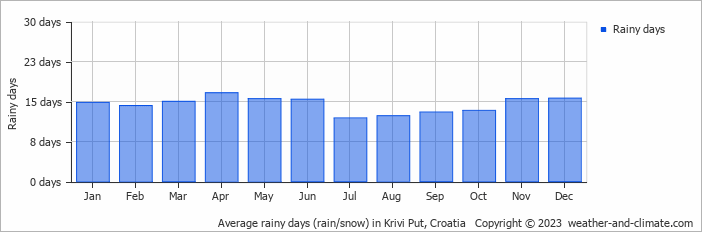
- Most rainy days are in March, April, May, June, November and December.
- On average, April is the most rainy with 16 days of rain/snow.
- On average, July is the driest month with 11 rainy days.
- The average annual number of rainy days is 173.
Forecast for Krivi Put
Sat May 04
19°C | 8°C
E  18 km/h
18 km/h0.6 mm
partly cloudy and chance of slight rain
Sun May 05
18°C | 9°C
W 11 km/h
11 km/halmost clear and no rain
Mon May 06
19°C | 10°C
SW 18 km/h
18 km/hpartly cloudy and no rain


