Average Rainy - Precipitation days in Dragør
With 167 days and 740 mm of annual rain/snow, Dragør has a moderate precipitation pattern. On this page, you can learn everything about the number of precipitation days.
Monthly Distribution of Rainy Days
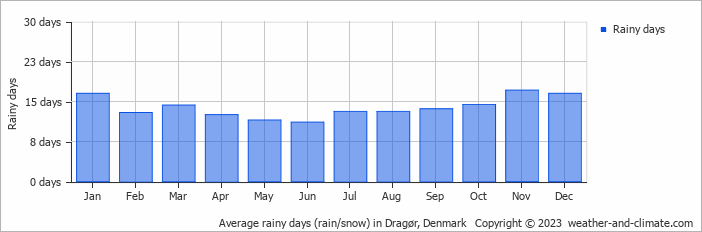
The wettest month is August, with 13 rainy days bringing 78 mm of rain. In contrast, April sees 13 rainy days with 44 mm of rain.
Amsterdam Precipitation Days Compared World Wide
On average, Dragør receives over 167 days of precipitation annually. For comparison, here is some data from popular tourist destinations around the world:In Cairo, Egypt, there are only about 16 precipitation days annually, making it one of the driest capitals in the world.
In Bogotá, Colombia, there are around 188 precipitation days annually, typical for its high-altitude tropical climate.
In Barcelona, Spain, there are approximately 121 precipitation days per year, evenly distributed across the year with no extreme wet or dry seasons.
Chicago, USA, has 133 precipitation days annually, with a mix of rain and snow.
Buenos AiresBuenos Aires, Argentina, has around 92 precipitation days annually, mostly during the summer months.
Perth, Australia, sees approximately 103 precipitation days annually, mostly during the winter months.
Rain Facts From Around the Globe
Let’s explore more fascinating precipitation records:
- Tutunendo, Colombia, gets about 340 days of rain every year, which arguably makes it the wettest place in the world.
- On Réunion Island, a tropical cyclone generated 1825 mm in just 24 hours.
- Singapore receives thunder on 167 days in the year and is considered one of the most thunderous cities in the world.
- The smallest drops that fall are called drizzle drops, and they have a diameter of 0.5 mm.
- Some heavy storms generate "diamond dust," which consists of very small ice crystals that float in the air.
For more detailed information about rainfall patterns in Dragør, visit our Rainfall & Precipitation page.
Current rainfall in Dragør


