ClimateForecastMayJune >>

Average monthly rainy days in Coñaripe

The number of days each month with rain, snow and hail in Coñaripe (Los Rios), Chile.

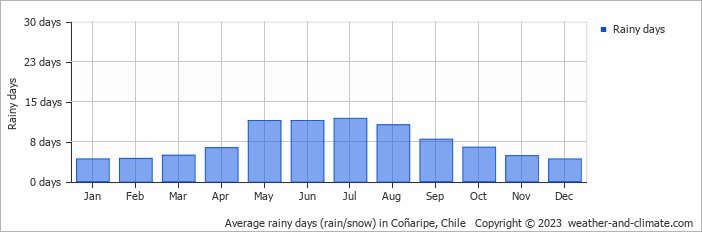
  • On average, July is the most rainy with 11 days of rain/snow.
  • On average, January is the driest month with 4 rainy days.
  • The average annual number of rainy days is 88.

Forecast for Coñaripe

Sat   May 04
5°C | 0°C
NW 22 km/h
40 mm
overcast and heavy sleet

overcast and heavy sleet

Sun   May 05
4°C | -1°C
NW 14 km/h
12 mm
overcast and heavy sleet

overcast and heavy sleet

Mon   May 06
6°C | 2°C
N 22 km/h
55 mm
overcast and heavy rain

overcast and heavy rain

Interested in more climate information?

This site provides you with all the information you need about the climate in Coñaripe.

Our site offers climate and forecast data for every country in the world. Are you going to Chile? On this website you can find historical weather averages for many cities in Chile. Not sure yet where to go? We now have a tool which recommends destinations that suit your ideal climate conditions. Find out where to go with our weather planner.