ClimateForecastMayJune >>

Average monthly rainy days in Cavriana

The number of days each month with rain, snow and hail in Cavriana (Lombardy), Italy.

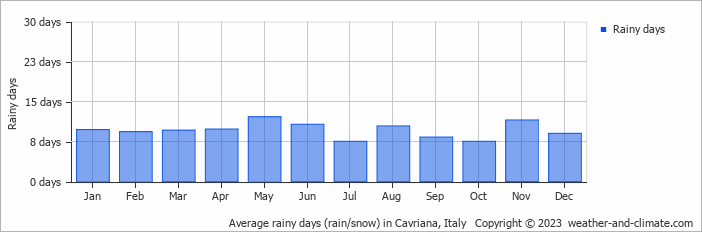
  • On average, May is the most rainy with 12 days of rain/snow.
  • On average, October is the driest month with 7 rainy days.
  • The average annual number of rainy days is 115.

Forecast for Cavriana

Sat   May 04
22°C | 11°C
W 7 km/h
partly cloudy and no rain

partly cloudy and no rain

Sun   May 05
23°C | 13°C
W 11 km/h
partly cloudy and no rain

partly cloudy and no rain

Mon   May 06
22°C | 14°C
S 7 km/h
0.5 mm
broken clouds and small chance of slight rain

broken clouds and small chance of slight rain

Interested in more climate information?

This site provides you with all the information you need about the climate in Cavriana.

Our site offers climate and forecast data for every country in the world. Are you going to Italy? On this website you can find historical weather averages for many cities in Italy. Not sure yet where to go? We now have a tool which recommends destinations that suit your ideal climate conditions. Find out where to go with our weather planner.