Average Rainy - Precipitation days in Carpiano
Carpiano sees 141 days of precipitation annually, totaling to 1041 mm of rain/snow. Learn more about it on this page.
Monthly Distribution of Rainy Days
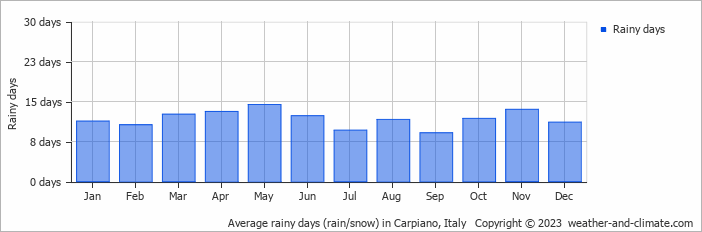
The wettest month is November, with 14 rainy days bringing 129 mm of rain. In contrast, January sees 11 rainy days with 60 mm of rain.
Amsterdam Precipitation Days Compared World Wide
Carpiano's average annual precipitation falls over 141 days. Let's compare this to some popular worldwide tourist destinations:
In Riyadh, Saudi Arabia, there are about 29 precipitation days annually, reflecting its dry desert environment.
In Kuala Lumpur, Malaysia, the city experiences around 212 precipitation days annually, consistent with its tropical rainforest climate.
In Lisbon, Portugal, there are an average of 113 precipitation days annually, characterized by wet winters and dry summers typical of the Mediterranean climate.
In Toronto, Canada, there are about 126 precipitation days per year, with snowfall occurring in winter and rainfall in summer.
Osaka, Japan, experiences 198 precipitation days annually, with wetter summers compared to winter.
In Brisbane, Australia, the city averages 123 precipitation days per year, making it wetter than Sydney.
Rain Facts From Around the Globe
Here are some amazing facts about rain and precipitation worldwide:
- Cherrapunji, India, records an average of 322 rainy days each year. Despite this, the wettest place is Mount Waialeale in Hawaii with 11500 mm annual rainfall.
- The fastest recorded raindrop fell at 18 meters per second during a thunderstorm in Brazil.
- The Atacama Desert in Chile is so dry that some weather stations have never recorded rainfall since their installation.
- The largest recorded raindrop measured 8.8 mm in diameter during a tropical storm on La Réunion Island.
- Some clouds can weigh up to 500,000 tons, that's equivalent to the weight of 100 elephants.
For more detailed information about rainfall patterns in Carpiano, visit our Rainfall & Precipitation page.
Current rainfall in Carpiano


