Monthly Average Rainy days in Caldera
The number of days each month with rain, snow and hail in Caldera (Atacama), Chile.
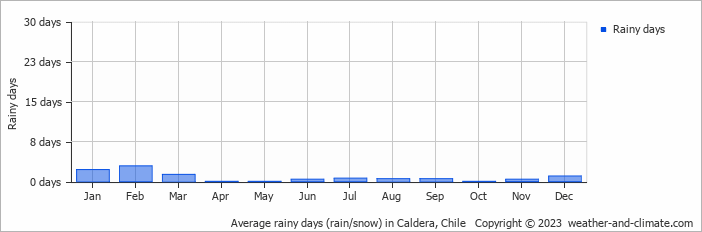
- Caldera has dry periods in March, April, May, June, July, August, September, October, November and December.
- On average, February is the most rainy with 2 days of rain/snow.
- On average, October is the driest month with 0 rainy days.
- The average annual number of rainy days is 9.
Current rainfall in Caldera
Sun Dec 15
19°C | 13°C
SW  22 km/h
22 km/halmost clear and no rain
Mon Dec 16
19°C | 13°C
SW 22 km/h
22 km/halmost clear and no rain
Tue Dec 17
18°C | 13°C
SW 22 km/h
22 km/h0.5 mm
broken clouds and small chance of slight rain