Average Rainy - Precipitation days in Bolilmark
Bolilmark sees 185 days of precipitation annually, totaling to 1042 mm of rain/snow. Learn more about it on this page.
Monthly Distribution of Rainy Days
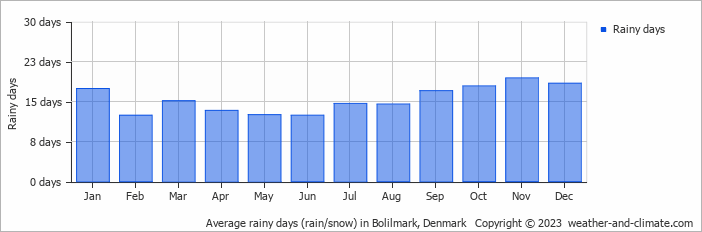
October is usually the wettest with 114 mm of rain over 18 rainy days, whereas April averages 49 mm during its 13 rainy days.
Amsterdam Precipitation Days Compared World Wide
Bolilmark's average annual precipitation falls over 185 days. Let's compare this to some popular worldwide tourist destinations:
In Cairo, Egypt, there are only about 16 precipitation days annually, making it one of the driest capitals in the world.
Singapore, Singapore, records about 175 precipitation days per year, with rain spread fairly evenly throughout the year.
In Athens, Greece, it rains around 70 days in the year; therefore, it is one of the driest Mediterranean cities, mainly dominated by winter rainfall.
The climate in San Francisco, USA, sees around 70 precipitation days annually, mostly during the winter months.
Beijing, China, averages 72 precipitation days annually, concentrated in the summer months.
Melbourne, Australia, has about 120 precipitation days annually, spread fairly evenly throughout the year.
Fun facts about Rain from Around the World
Here are some amazing facts about rain and precipitation worldwide:
- Cherrapunji, India, records an average of 322 rainy days each year. Despite this, the wettest place is Mount Waialeale in Hawaii with 11500 mm annual rainfall.
- The fastest recorded raindrop fell at 18 meters per second during a thunderstorm in Brazil.
- The Atacama Desert in Chile is so dry that some weather stations have never recorded rainfall since their installation.
- The largest recorded raindrop measured 8.8 mm in diameter during a tropical storm on La Réunion Island.
- Some clouds can weigh up to 500,000 tons, that's equivalent to the weight of 100 elephants.
For more detailed information about rainfall patterns in Bolilmark, visit our Rainfall & Precipitation page.
Current rainfall in Bolilmark


