Monthly Average Rainy days in Alwar
The number of days each month with rain, snow and hail in Alwar (Rajasthan), India.
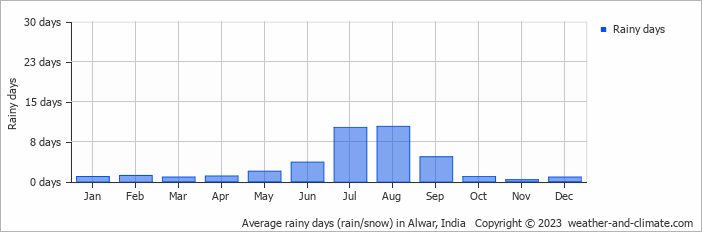
- Alwar has dry periods in January, February, March, April, May, October, November and December.
- On average, August is the most rainy with 10 days of rain/snow.
- On average, November is the driest month with 0 rainy days.
- The average annual number of rainy days is 36.
Current rainfall in Alwar
Fri Jan 10
21°C | 7°C
SE  2 m/s
2 m/s
2 m/sclear and no rain
Sat Jan 11
18°C | 6°C
NE 3 m/s
3 m/s17 mm
broken clouds and rain
Sun Jan 12
21°C | 8°C
SE 1 m/s
1 m/spartly cloudy and no rain


