Average monthly rainy days in Windhoek

The number of days each month with rain, snow and hail in Windhoek (), Namibia.

Average monthly rainy days in Windhoek,

Feel free to add this climate graph to your website. Click the copy button above.

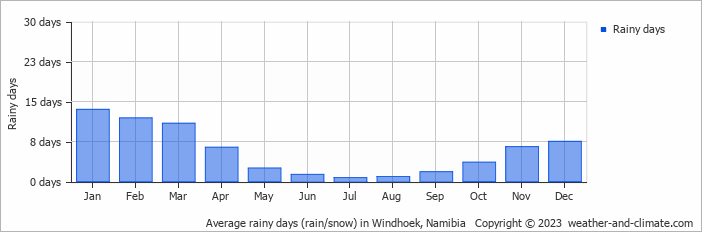
  • Windhoek has dry periods in June, July, August and September.
  • On average, January is the most rainy with 13 days of rain/snow.
  • On average, July is the driest month with 0 rainy days.
  • The average annual number of rainy days is 67.

Weather Forecasts for Windhoek

Thu   Mar 28
27°C | 13°C
NW 7 km/h
almost clear and no rain

almost clear and no rain

Fri   Mar 29
28°C | 14°C
E 14 km/h
0.5 mm
partly cloudy and slight rain

partly cloudy and slight rain

Sat   Mar 30
26°C | 15°C
N 14 km/h
4.1 mm
partly cloudy and thunder

partly cloudy and thunder

Interested in more climate information?

Weather and Climate provides you with all the information you need about the climate in Windhoek.

Our site offers climate and forecast data for every country in the world. Are you going to Namibia? On this website you can find historical weather averages for many cities in Namibia. Not sure yet where to go? We now have a tool which recommends destinations that suit your ideal climate conditions. Find out where to go with our weather planner.