Monthly Average Rainy days in Gabriola Island
The number of days each month with rain, snow and hail in Gabriola Island (British Columbia), Canada.
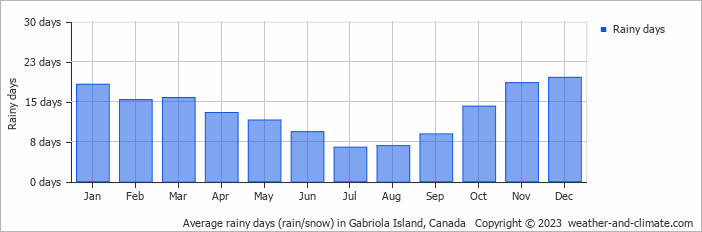
- Most rainy days are in January, February, March, November and December.
- On average, December is the most rainy with 19 days of rain/snow.
- On average, July is the driest month with 6 rainy days.
- The average annual number of rainy days is 157.
Current rainfall in Gabriola Island
Wed Jan 15
8°C | 3°C
SE  3 m/s
3 m/s
3 m/sbroken clouds and no rain
Thu Jan 16
8°C | 5°C
NW 7 m/s
7 m/s0.2 mm
partly cloudy and slight rain
Fri Jan 17
7°C | 2°C
NW 3 m/s
3 m/salmost clear and no rain