Ytre Ålvik Weather & Climate: Best Time to Visit
Average temperatures, rainfall, sunshine and the best time to visit Ytre Ålvik.
Climate overview of Ytre Ålvik
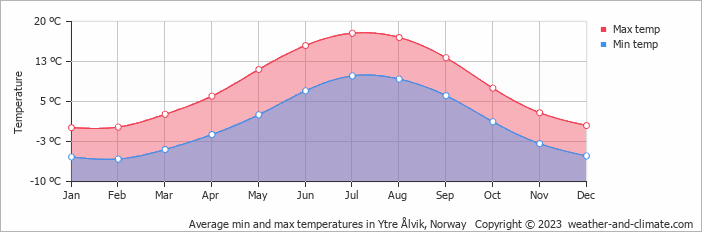
Temperatures in Ytre Ålvik, Hordaland, Norway, vary greatly throughout the year. July is the hottest month at 18°C (64°F), while February is the coldest at 0°C (32°F).
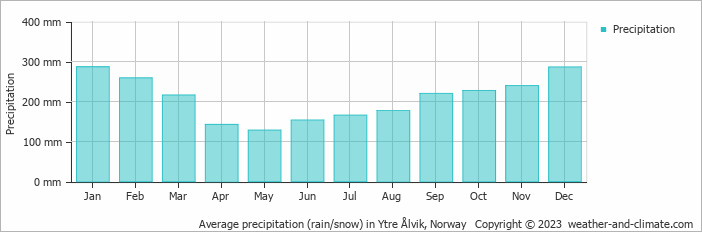
The city has a wet climate, receiving around 2499 mm (98 in) of rain/snowfall per year. Despite the high annual total, it has a distinct rainy season from August to March. January is the wettest month. Sunshine peaks in June, when the city sees around 6.4 hours of sunshine per day.
Ytre Ålvik Weather by Month
Pick a month to see the average temperature, rainfall and sunshine in Ytre Ålvik — and find the best time to visit.
Monthly Temperature in Ytre Ålvik
The climate in Ytre Ålvik is known for significant temperature differences throughout the year, making the weather dynamic. On average, daytime temperatures range from a moderate 18°C (64°F) in July to a very cold 0°C (32°F) in February.
Nighttime temperatures range from 10°C (50°F) in July to -6°C (21°F) in February.
Check out our detailed temperature page for more information.
Temperature ranges by month
Rainfall in Ytre Ålvik
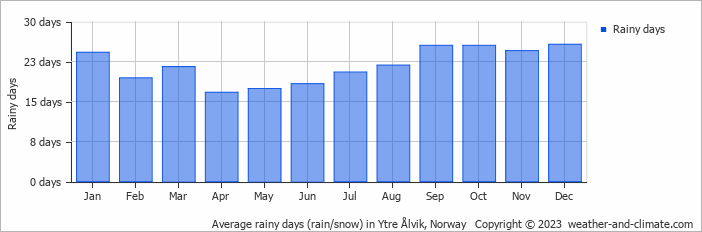
Ytre Ålvik has a notably wet climate with abundant precipitation, recording 2499 mm (98 in) of rain/snowfall per year. The seasons in Ytre Ålvik bring significant changes in precipitation. The wettest month, January, receives heavy snowfall, with an average of 286 mm (11 in) of precipitation. This snowfall is distributed across 24 snowy days.
In contrast, the driest month, May, experiences much less rainfall, totaling 128 mm (5 in) over 17 rainy days. These distinct seasonal differences provide diverse experiences throughout the year. For more details, please visit our Ytre Ålvik Precipitation page.
The mean monthly precipitation over the year, including rain, hail, and snow
The average number of days each month with precipitation
Sunshine Hours in Ytre Ålvik
In Ytre Ålvik, summer days are longer and more sunny, with daily sunshine hours peaking at 6.4 hours in June. As the darker season arrives, the brightness of the sun becomes less. December sees a soft sun for only 0.4 hours per average day.
Visit our detailed sunshine hours page for more information.
Monthly hours of sunshine
Daily hours of sunshine
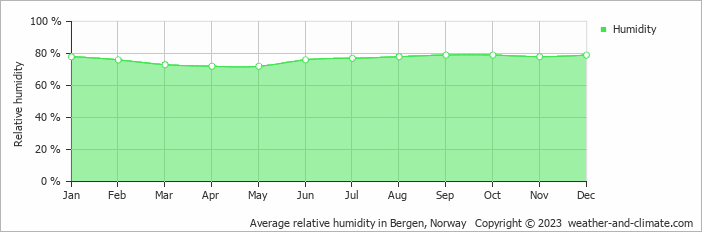
Humidity in Ytre Ålvik by Month
The relative humidity is high throughout the year in Ytre Ålvik.
The city experiences its highest humidity in September, reaching 79%. In April, the humidity drops to its lowest level at 72%. What does this mean? Read our detailed page on humidity levels for further details.
Relative humidity over the year
Best Time to Visit Ytre Ålvik
Frequently asked questions about the climate in Ytre Ålvik
What is the best time to visit Ytre Ålvik?
July typically offers the most optimal weather in Ytre Ålvik. In contrast, January, February, March, April, May, September, October, November and December tend to have less optimal conditions. Ytre Ålvik has a distinct rainy season from August to March.
What temperatures can I expect in Ytre Ålvik?
Daytime highs range from 0°C (32°F) in February to 18°C (64°F) in July. Nighttime lows range from -6°C (21°F) to 10°C (50°F). Temperatures vary considerably through the year.
How much rain does Ytre Ålvik get?
Annual rainfall is around 2499 mm (98 in). January is the wettest month with 286 mm (11 in), while May is the driest with 128 mm (5 in). In the coldest months, precipitation may fall as snow.
How sunny is Ytre Ålvik?
Ytre Ålvik receives around 1,232 hours of sunshine per year. June is the sunniest month with 193 hours, while December is the cloudiest with just 13 hours.
Ytre Ålvik 3-Day Forecast
Ytre Ålvik 3-Day Forecast
Ytre Ålvik on the map
Ytre Ålvik is highlighted — select any city to see its climate.
Popular this month
Where to go in July — average daytime high across popular destinations.
Bucket list
Need travel inspiration? Check out our bucket list articles and be inspired.
 The rugged landscape of the Norwegian fjords
This landscape is rated as the most beautiful in the world and it is something you need to experience at least once in your life.
Discover Norway's Hidden Gem: The Littleisland Lighthouse
Explore Littleisland Lighthouse in Norway - a serene getaway offering unique stays, breathtaking views, and a journey into tranquil simplicity.
The Majestic Geirangerfjord: Norway's Crown Jewel
Explore Norway's stunning Geirangerfjord, famous for its dramatic cliffs, waterfalls, and scenic routes. Breathtaking landscapes and outdoor adventures
Swimming with orcas in Norway
The best travel period to travel to Norway for the orcas are the months October, November December, January and February. Swimming with orcas in Norway might be the bucket list trip of your life.