Wijk aan Zee Weather & Climate: Best Time to Visit
Average temperatures, rainfall, sunshine and the best time to visit Wijk aan Zee.
Climate overview of Wijk aan Zee
Wijk aan Zee Weather by Month
Pick a month to see the average temperature, rainfall and sunshine in Wijk aan Zee — and find the best time to visit.
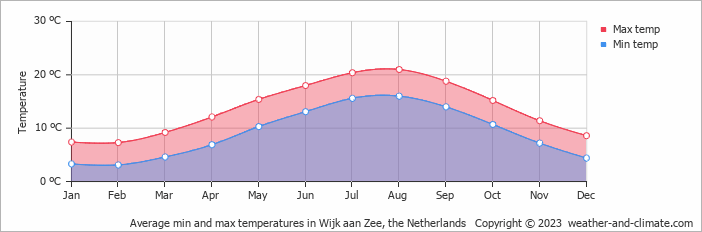
Monthly Temperature in Wijk aan Zee
The climate in Wijk aan Zee is known for significant temperature differences throughout the year, making the weather dynamic. Average daytime temperatures reach a pleasant 21°C (70°F) in August. In February, the coolest month of the year, temperatures drop to a chilly 7°C (45°F).
At night, temperatures range from around 16°C (61°F) in August to 3°C (37°F) in February.
Check out our detailed temperature page for more information.
Temperature ranges by month
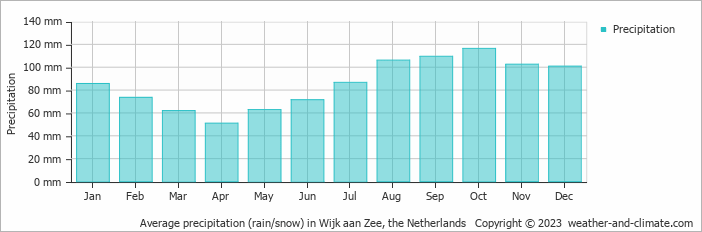
Rainfall in Wijk aan Zee
Wijk aan Zee has a notably wet climate with abundant precipitation, recording 1028 mm (40 in) of rainfall per year. Wijk aan Zee can be quite wet during October, receiving approximately 116 mm (4.6 in) of precipitation over 17 rainy days.
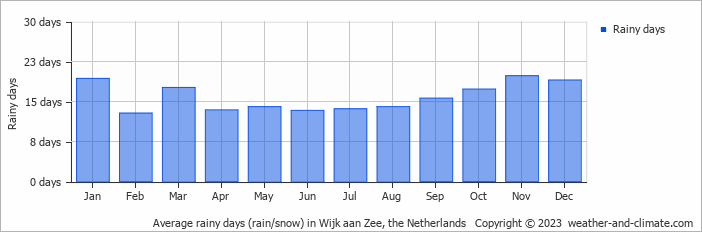
In contrast, during the driest month (April), you will experience much drier conditions, with 51 mm (2 in) of precipitation spread across 13 rainy days days. For more details, please visit our Wijk aan Zee Precipitation page.
The mean monthly precipitation over the year, including rain, hail, and snow
The average number of days each month with precipitation
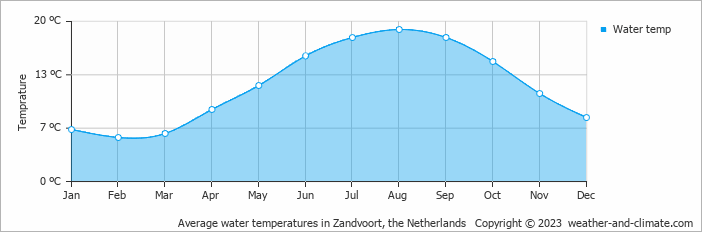
Water Temperature in Wijk aan Zee
The mean water temperature over the year ranges from 6°C (43°F) in February to 19°C (66°F) in August.
Water temperature over the year
Best Time to Visit Wijk aan Zee
Frequently asked questions about the climate in Wijk aan Zee
What is the best time to visit Wijk aan Zee?
July typically offers the most optimal weather in Wijk aan Zee. In contrast, January, February, March, November and December tend to have less optimal conditions.
What temperatures can I expect in Wijk aan Zee?
Daytime highs range from 7°C (45°F) in February to 21°C (70°F) in August. Nighttime lows range from 3°C (37°F) to 16°C (61°F). Temperatures vary considerably through the year.
How much rain does Wijk aan Zee get?
Annual rainfall is around 1028 mm (40 in). October is the wettest month with 116 mm (4.6 in), while April is the driest with 51 mm (2 in).
Wijk aan Zee 3-Day Forecast
Wijk aan Zee 3-Day Forecast
Wijk aan Zee on the map
Wijk aan Zee is highlighted — select any city to see its climate.
Popular this month
Where to go in July — average daytime high across popular destinations.
Bucket list
Need travel inspiration? Check out our bucket list articles and be inspired.
 Flower fields in the Netherlands
The flower fields in The Netherlands are world famous. The red, pink and yellow colors are breathtakingly beautiful and should be on the bucket list.
Pride in Amsterdam
Nowhere in the world is Pride being celebrated on the water on such a scale as in Amsterdam. It is an unique experience that every person needs to add to his, her or its bucket list.
The greenest experience of Amsterdam
If you’re looking for an experience of Amsterdam that is rooted in nature, that can help you go outside and get your hands dirty, then these tips are for you.
Amsterdam Dance Event
ADE is one of the larger festival giants, but you may never have heard of it if you are not an electronic music fan. It last five days and takes place in October.