ClimateForecastAprilMay >>

Average water temperature in Wijk aan Zee

The mean water temperature over the year in Wijk aan Zee (Noord-Holland), the Netherlands.

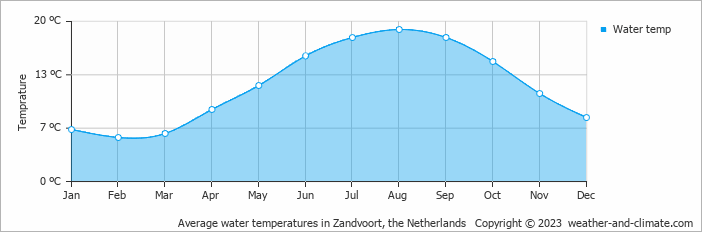
* Data from: Zandvoort, the Netherlands (14 KM, 8 Miles).
  • The months July, August and September have a pleasant water temperature.
  • On average, August has the warmest water temperature with 19°C.
  • On average, February has the coldest water temperature with 6°C.

Weather Forecasts for Wijk aan Zee

Mon   Apr 29
18°C | 7°C
S 18 km/h
partly cloudy and no rain

partly cloudy and no rain

Tue   Apr 30
20°C | 10°C
SE 14 km/h
0.6 mm
partly cloudy and small chance of slight rain

partly cloudy and small chance of slight rain

Wed   May 01
21°C | 12°C
N 22 km/h
almost clear and no rain

almost clear and no rain

Interested in more climate information?

Weather and Climate provides you with all the information you need about the climate in Wijk aan Zee.

Our site offers climate and forecast data for every country in the world. Are you going to the Netherlands? On this website you can find historical weather averages for many cities in the Netherlands. Not sure yet where to go? We now have a tool which recommends destinations that suit your ideal climate conditions. Find out where to go with our weather planner.

) ?>