Vinderup Weather & Climate: Best Time to Visit
Average temperatures, rainfall, sunshine and the best time to visit Vinderup.
Climate overview of Vinderup
Vinderup, Midtjylland, Denmark, experiences significant temperature variation throughout the year. Summers bring daytime highs of 22°C (72°F) in July, while winters cool to 5°C (41°F) in January.
Annual rain/snowfall is moderate at around 867 mm (34 in), with August being the wettest month. The city also has pleasant summers and cold winters. The sunniest month is June, with 7.6 hours of sunshine per day on average.
Vinderup Weather by Month
Pick a month to see the average temperature, rainfall and sunshine in Vinderup - and find the best time to visit.
Monthly Temperature in Vinderup
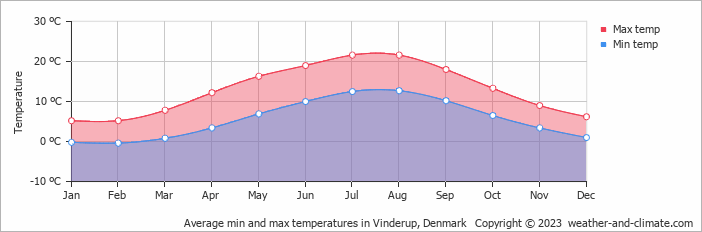
Depending on the time of the year, temperatures range from pleasant to chilly in Vinderup. Average daytime temperatures reach a pleasant 22°C (72°F) in July. In January, the coolest month of the year, temperatures drop to a chilly 5°C (41°F).
At night, temperatures range from around 13°C (55°F) in July to 0°C (32°F) in January.
Check out our detailed temperature page for more information.
Temperature ranges by month
Rainfall in Vinderup
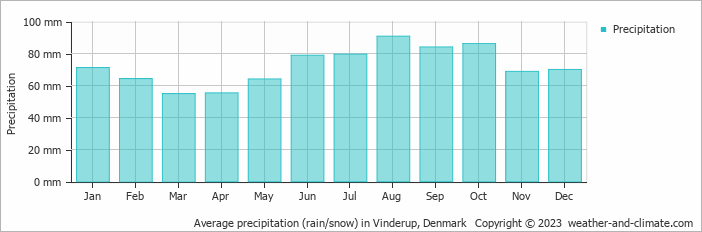
Generally, Vinderup has a moderate amount of precipitation, averaging 867 mm (34 in) of rain/snowfall annually. Vinderup experiences moderate seasonal variation in rainfall, with monthly averages ranging from 91 mm (3.6 in) in August, the wettest month, and 55 mm (2.2 in) in March, the driest month. For more details, please visit our Vinderup Precipitation page.
The mean monthly precipitation over the year, including rain, hail, and snow
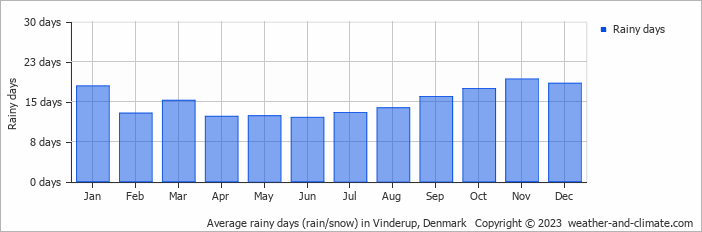
The average number of days each month with precipitation
Sunshine Hours in Vinderup
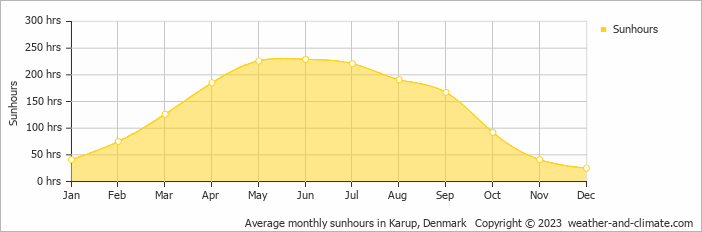
Vinderup can be enjoyed more throughout the sunniest month of June under a blue sky, with approximately 7.6 hours of sunshine daily. In contrast, the city experiences much darker days in December, with only 0.8 hours of sunlight per day.
Visit our detailed sunshine hours page for more information.
Monthly hours of sunshine
Daily hours of sunshine
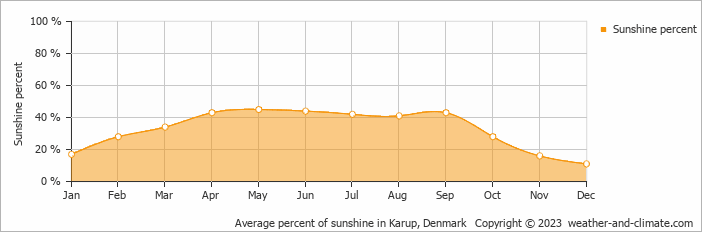
Daily percentage of sunshine
Humidity in Vinderup by Month
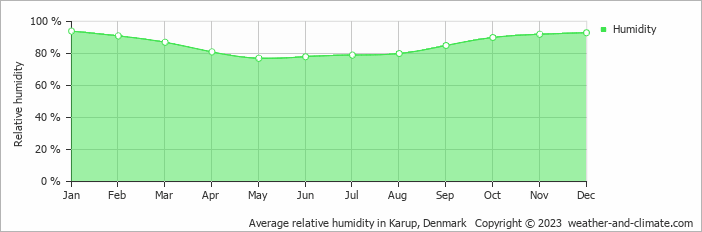
The city experiences its highest humidity in January, reaching 94%. In May, the humidity drops to its lowest level at 77%. What does this mean? Read our detailed page on humidity levels for further details.
Relative humidity over the year
Best Time to Visit Vinderup
Monthly ratings reflect general weather comfort, based on daytime temperature and rainfall. Swimming and winter conditions are highlighted separately where relevant.
- Best overall: July and August
- Warmest weather: July and August
- Most sunshine: May, June and July
- Seasonal pattern: Pleasant summers and cold winters
- Coldest conditions: January, with freezing nights around 0°C (32°F).
Frequently asked questions about the climate in Vinderup
What is the best time to visit Vinderup?
July and August typically offer the most optimal weather in Vinderup. In contrast, January, February, March, November and December tend to have less optimal conditions. Vinderup has pleasant summers and cold winters.
What temperatures can I expect in Vinderup?
Daytime highs range from 5°C (41°F) in January to 22°C (72°F) in July. Nighttime lows range from 0°C (32°F) to 13°C (55°F). Temperatures vary considerably through the year.
How much rain does Vinderup get?
Annual rainfall is around 867 mm (34 in). August is the wettest month with 91 mm (3.6 in), while March is the driest with 55 mm (2.2 in).
How sunny is Vinderup?
Vinderup receives around 1,619 hours of sunshine per year. June is the sunniest month with 229 hours, while December is the cloudiest with just 25 hours.
Vinderup 3-Day Forecast
Vinderup 3-Day Forecast
Vinderup on the map
Vinderup is highlighted - select any city to see its climate.
Popular this month
Where to go in July - average daytime high across popular destinations.