Villány Weather & Climate: Best Time to Visit
Average temperatures, rainfall, sunshine and the best time to visit Villány.
Climate overview of Villány
The climate in Villány, Baranya, Hungary, is marked by large temperature swings across the seasons, ranging from 29°C (84°F) in August to 5°C (41°F) in January.
Villány sees a moderate amount of rain/snowfall, totalling around 718 mm (28 in) per year. July is the sunniest month, averaging 9.8 hours of sunshine per day.
Villány Weather by Month
Pick a month to see the average temperature, rainfall and sunshine in Villány — and find the best time to visit.
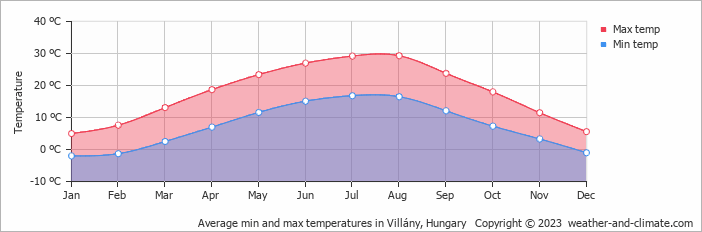
Monthly Temperature in Villány
In Villány, temperatures differ significantly between summer and winter months. Average maximum daytime temperatures range from a comfortable 29°C (84°F) in August, the warmest time of the year, to a chilly 5°C (41°F) during cooler months like January.
At night, you can expect temperatures ranging from 17°C (63°F) in August to around -2°C (28°F) during January.
Check out our detailed temperature page for more information.
Temperature ranges by month
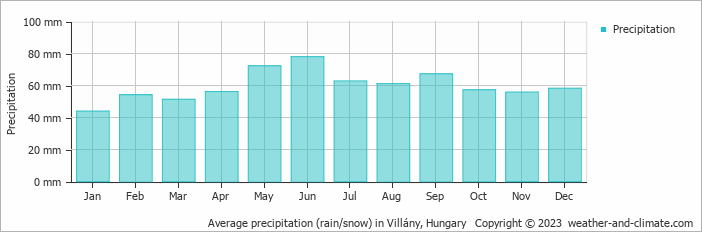
Rainfall in Villány
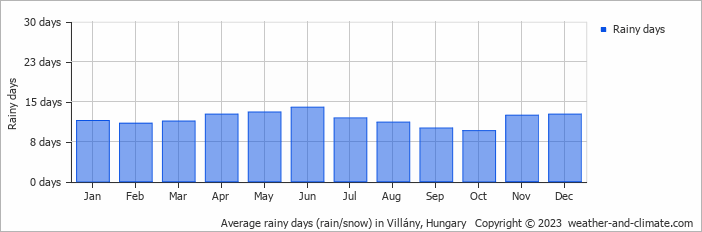
On average, Villány receives a reasonable amount of rain/snowfall, with an annual precipitation of 718 mm (28 in). While rainfall varies throughout the year, each season offers its own charm. June brings wetter days averaging 78 mm (3.1 in) of precipitation, spread over 14 rainy days.
In contrast, the driest month January experiences a drier climate, with about 44 mm (1.7 in) of snow/rainfall spread across 11 snowy/rainy days. For more details, please visit our Villány Precipitation page.
The mean monthly precipitation over the year, including rain, hail, and snow
The average number of days each month with precipitation
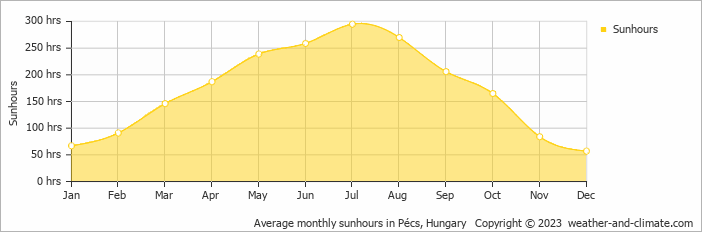
Sunshine Hours in Villány
Seasonal changes in sunshine hours are quite dramatic in Villány. While July receives considerable daily sunshine with up to 9.8 hours, December marks the darkest time of the year, where sunshine is scarce with only 1.9 hours of sunlight per day.
Visit our detailed sunshine hours page for more information.
Monthly hours of sunshine
Daily hours of sunshine
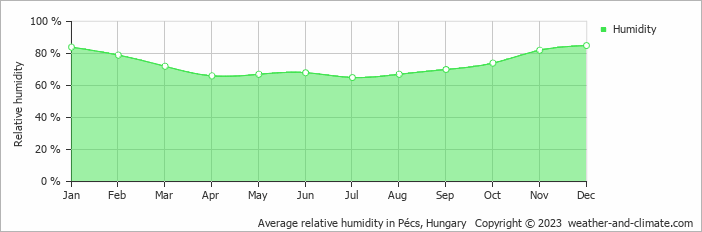
Humidity in Villány by Month
The relative humidity is high throughout the year in Villány.
The city experiences its highest humidity in December, reaching 85%. In July, the humidity drops to its lowest level at 65%. What does this mean? Read our detailed page on humidity levels for further details.
Relative humidity over the year
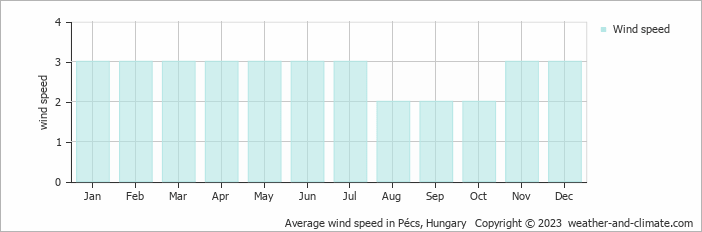
Wind Speed in Villány
The average wind speed over the year ranges from 2 m/s (4 knots) to 3 m/s (6 knots). It is lower in August, September and October and higher in January, February, March, April, May, June, July, November and December. What does this mean?
The mean monthly wind speed over the year (meters per second)
Best Time to Visit Villány
Frequently asked questions about the climate in Villány
What is the best time to visit Villány?
May, June, July, August and September typically offer the most optimal weather in Villány. In contrast, January, February and December tend to have less optimal conditions.
What temperatures can I expect in Villány?
Daytime highs range from 5°C (41°F) in January to 29°C (84°F) in August. Nighttime lows range from -2°C (28°F) to 17°C (63°F). Temperatures vary considerably through the year.
How much rain does Villány get?
Annual rainfall is around 718 mm (28 in). June is the wettest month with 78 mm (3.1 in), while January is the driest with 44 mm (1.7 in).
How sunny is Villány?
Villány receives around 2,066 hours of sunshine per year. July is the sunniest month with 295 hours, while December is the cloudiest with just 57 hours. Overall, Villány enjoys abundant sunshine.
Villány 3-Day Forecast
Villány 3-Day Forecast
Villány on the map
Villány is highlighted — select any city to see its climate.
Popular this month
Where to go in July — average daytime high across popular destinations.
Bucket list
Need travel inspiration? Check out our bucket list articles and be inspired.
 7 of the most budget-friendly destinations in Europe
Discover Europe's top budget-friendly destinations including Budapest, Kotor, Krakow, and more, perfect for affordable and exciting travel.
Sziget Festival
Sziget Hungary is the largest open-air festival in Europe. The festival takes place seven days and you can enjoy more than 1,000 performances on 60 different stages.
 Cycle the Danube trail
The Danube cycle route is one of the most popular cycling routes in Europe, and rightly so, because it is a varied route that is interesting both in terms of culture and nature.