Vejlby Weather & Climate: Best Time to Visit
Average temperatures, rainfall, sunshine and the best time to visit Vejlby.
Climate overview of Vejlby
The climate in Vejlby, Denmark, is marked by large temperature swings across the seasons, ranging from 20°C (68°F) in August to 5°C (41°F) in February.
With around 997 mm (39 in) of annual rain/snowfall, the city has moderate precipitation levels. October is the wettest month and April the driest. June is the sunniest month, averaging 8.3 hours of sunshine per day.
Vejlby Weather by Month
Pick a month to see the average temperature, rainfall and sunshine in Vejlby — and find the best time to visit.
Monthly Temperature in Vejlby
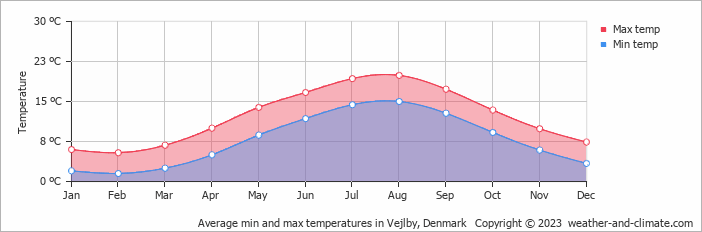
In Vejlby, temperatures differ significantly between summer and winter months. Typically, average maximum daytime temperatures range from a pleasant 20°C (68°F) in August to a chilly 5°C (41°F) in the coolest month, February.
Nights vary from 15°C (59°F) in August to around 2°C (36°F) during the colder months.
Check out our detailed temperature page for more information.
Temperature ranges by month
Rainfall in Vejlby
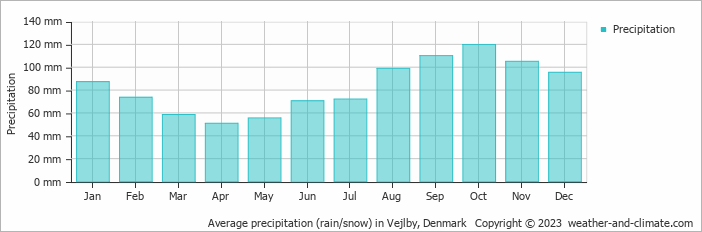
On average, Vejlby receives a reasonable amount of rain/snowfall, with an annual precipitation of 997 mm (39 in). The climate in Vejlby shows significant variation throughout the year. Expect high rainfall in October, the wettest month, with an average of 120 mm (4.7 in) of precipitation over 18 rainy days.
In contrast, the driest month April offers drier and sunnier days, with around 51 mm (2 in) of rainfall over 12 rainy days. For more details, please visit our Vejlby Precipitation page.
The mean monthly precipitation over the year, including rain, hail, and snow
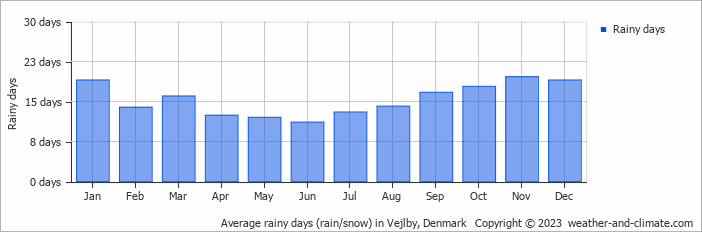
The average number of days each month with precipitation
Sunshine Hours in Vejlby
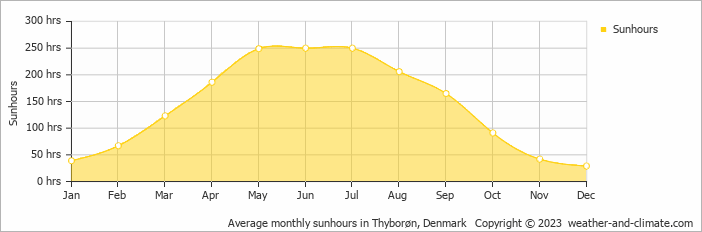
For those who appreciate different seasons, Vejlby serves as an ideal destination. Expect longer, more sun-filled days in June with an average of 8.3 hours of sunshine daily, and embrace the darker days in December, offering only 1.0 hours of daily sunlight.
Visit our detailed sunshine hours page for more information.
Monthly hours of sunshine
Daily hours of sunshine
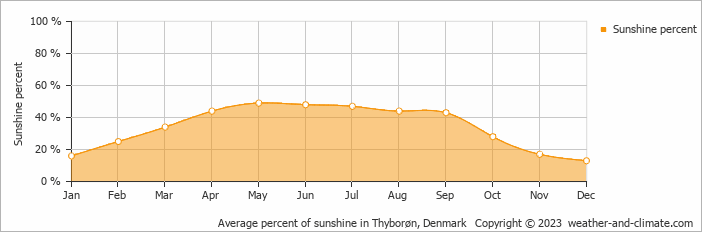
Daily percentage of sunshine
Water Temperature in Vejlby
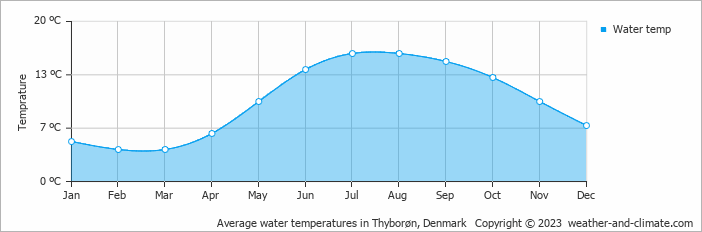
The mean water temperature over the year ranges from 4°C (39°F) in February to 16°C (61°F) in July.
Water temperature over the year
Humidity in Vejlby by Month
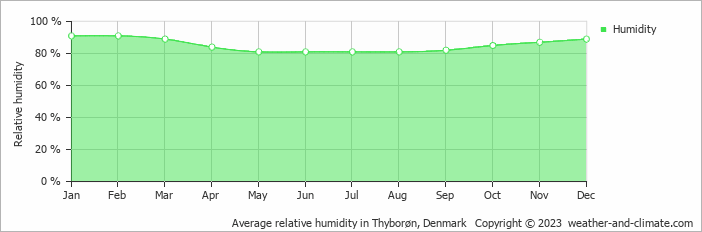
The city experiences its highest humidity in January, reaching 91%. In May, the humidity drops to its lowest level at 81%. What does this mean? Read our detailed page on humidity levels for further details.
Relative humidity over the year
Wind Speed in Vejlby
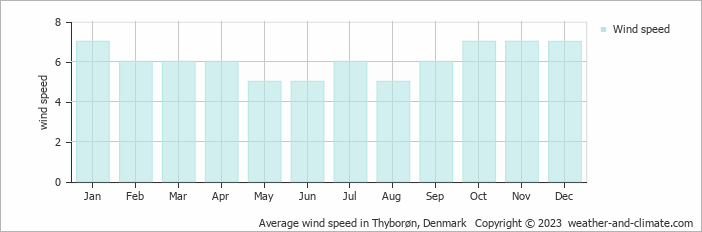
The average wind speed over the year ranges from 5 m/s (10 knots) to 7 m/s (14 knots). It is lower in May, June and August and higher in January, October, November and December. What does this mean?
The mean monthly wind speed over the year (meters per second)
Best Time to Visit Vejlby
Frequently asked questions about the climate in Vejlby
What is the best time to visit Vejlby?
August typically offers the most optimal weather in Vejlby. In contrast, January, February, March, April, October, November and December tend to have less optimal conditions.
What temperatures can I expect in Vejlby?
Daytime highs range from 5°C (41°F) in February to 20°C (68°F) in August. Nighttime lows range from 2°C (36°F) to 15°C (59°F). Temperatures vary considerably through the year.
How much rain does Vejlby get?
Annual rainfall is around 997 mm (39 in). October is the wettest month with 120 mm (4.7 in), while April is the driest with 51 mm (2 in).
How sunny is Vejlby?
Vejlby receives around 1,697 hours of sunshine per year. June is the sunniest month with 250 hours, while December is the cloudiest with just 29 hours.
Vejlby 3-Day Forecast
Vejlby 3-Day Forecast
Vejlby on the map
Vejlby is highlighted — select any city to see its climate.
Popular this month
Where to go in July — average daytime high across popular destinations.