Turgaj Weather & Climate: Best Time to Visit
Average temperatures, rainfall, sunshine and the best time to visit Turgaj.
Climate overview of Turgaj
Turgaj, Kazakhstan, experiences significant temperature variation throughout the year. Summers bring daytime highs of 31°C (88°F) in July, while winters cool to -9°C (16°F) in January.
Rain/snowfall is modest, totalling around 265 mm (10 in) annually. The city experiences very little rainfall year-round, with very warm summers and very cold winters. December tends to be the wettest month. The most sunshine falls in July, with an average of 11.5 hours of daily sunshine.
Turgaj Weather by Month
Pick a month to see the average temperature, rainfall and sunshine in Turgaj - and find the best time to visit.
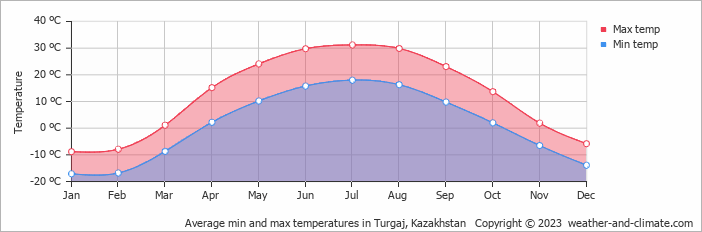
Monthly Temperature in Turgaj
Depending on the time of the year, temperatures range from very warm to very cold in Turgaj. Average maximum daytime temperatures range from a very warm 31°C (88°F) in July, the warmest time of the year, to a very cold -9°C (16°F) during cooler months like January.
At night, you can expect temperatures ranging from 18°C (64°F) in July to around -17°C (1°F) during January.
Check out our detailed temperature page for more information.
Temperature ranges by month
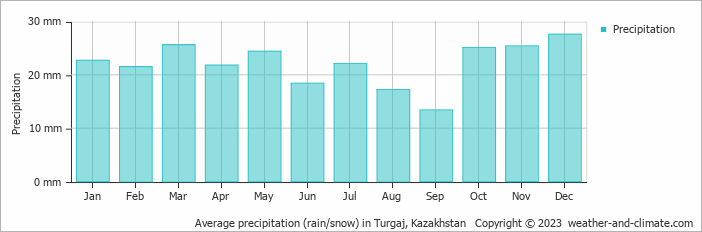
Rainfall in Turgaj
Turgaj maintains relatively dry conditions year-round, recording average annual precipitation of 265 mm (10 in). While snowfall varies throughout the year, each season offers its own charm. December brings wetter days averaging 28 mm (1.1 in) of precipitation, spread over 10 snowy days.
In contrast, the driest month September experiences a drier climate, with about 13 mm (0.5 in) of rainfall spread across 5 rainy days. For more details, please visit our Turgaj Precipitation page.
The mean monthly precipitation over the year, including rain, hail, and snow
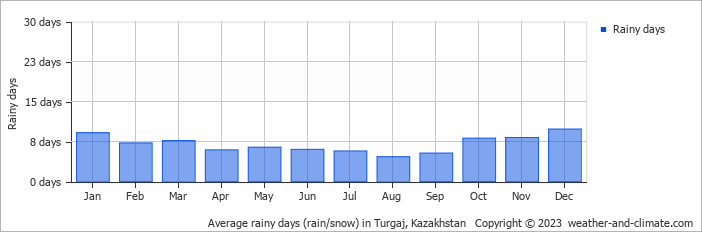
The average number of days each month with precipitation
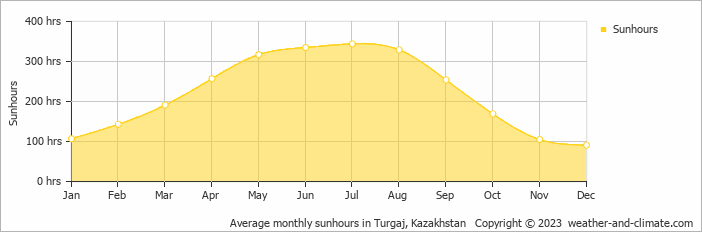
Sunshine Hours in Turgaj
Seasonal changes in sunshine hours are quite dramatic in Turgaj. While July receives considerable daily sunshine with up to 11.5 hours, December marks the darkest time of the year, where sunshine is scarce with only 3.0 hours of sunlight per day.
Visit our detailed sunshine hours page for more information.
Monthly hours of sunshine
Daily hours of sunshine
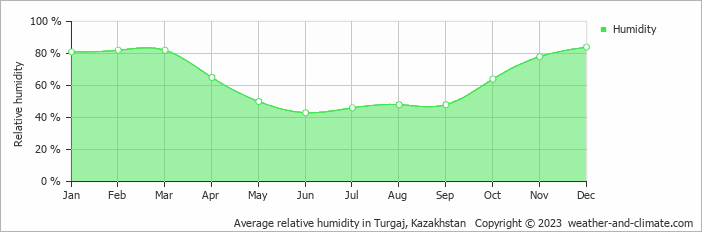
Humidity in Turgaj by Month
The relative humidity is high throughout the year in Turgaj.
The city experiences its highest humidity in December, reaching 84%. In June, the humidity drops to its lowest level at 43%. What does this mean? Read our detailed page on humidity levels for further details.
Relative humidity over the year
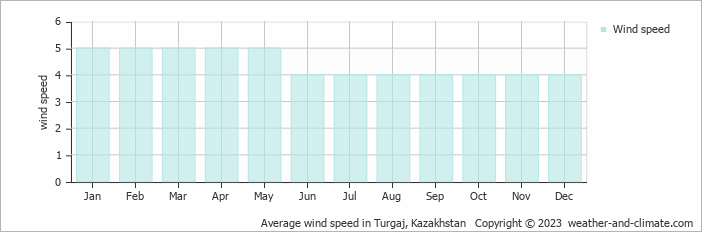
Wind Speed in Turgaj
The mean wind speed varies between 4 m/s (8 knots) and 5 m/s (10 knots) throughout the year. It is lowest in June, July, August, September, October, November and December and highest during January, February, March, April and May. What does this mean?
The mean monthly wind speed over the year (meters per second)
Best Time to Visit Turgaj
Monthly ratings reflect general weather comfort, based on daytime temperature and rainfall. Swimming and winter conditions are highlighted separately where relevant.
- Best overall: May and September
- Warmest weather: June, July and August
- Most sunshine: June, July and August
- Seasonal pattern: Very little rainfall year-round, with very warm summers and very cold winters
- Coldest conditions: January, with freezing nights around -17°C (1°F).
Frequently asked questions about the climate in Turgaj
What is the best time to visit Turgaj?
May and September typically offer the most optimal weather in Turgaj. In contrast, January, February, March, November and December tend to have less optimal conditions. Turgaj has very little rainfall year-round, with very warm summers and very cold winters.
What temperatures can I expect in Turgaj?
Daytime highs range from -9°C (16°F) in January to 31°C (88°F) in July. Nighttime lows range from -17°C (1°F) to 18°C (64°F). Temperatures vary considerably through the year.
How much rain does Turgaj get?
Annual rainfall is around 265 mm (10 in). December is the wettest month with 28 mm (1.1 in), while September is the driest with 13 mm (0.5 in). In the coldest months, precipitation may fall as snow.
How sunny is Turgaj?
Turgaj receives around 2,642 hours of sunshine per year. July is the sunniest month with 344 hours, while December is the cloudiest with just 91 hours. Overall, Turgaj enjoys abundant sunshine.
Turgaj 3-Day Forecast
Turgaj 3-Day Forecast
Turgaj on the map
Turgaj is highlighted - select any city to see its climate.
Popular this month
Where to go in July - average daytime high across popular destinations.
Bucket list
Need travel inspiration? Check out our bucket list articles and be inspired.