Trou dʼ Eau Douce Weather & Climate: Best Time to Visit
Trou dʼ Eau Douce, Mauritius, enjoys a steady climate throughout the year, with daytime temperatures typically around 27°C (81°F). February is the warmest month at 29°C (84°F), while August is the coolest at 24°C (75°F).
The city has a wet climate, receiving around 1145 mm (45 in) of rainfall per year. February is the wettest month. Sunshine peaks in December, when the city sees around 9.4 hours of sunshine per day.
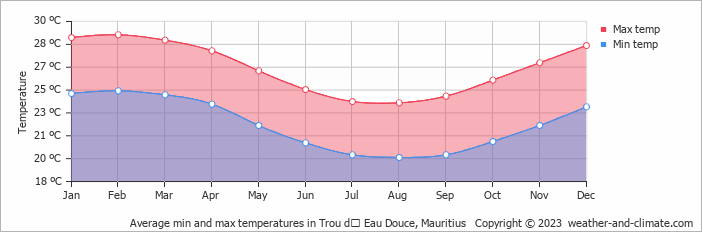
Monthly Temperature in Trou dʼ Eau Douce
The temperature in Trou dʼ Eau Douce remains steady throughout the year, providing a consistently comfortable climate. On average, daytime temperatures range from a comfortable 29°C (84°F) in February to a comfortable 24°C (75°F) in August.
Nighttime temperatures range from 25°C (77°F) in February to 20°C (68°F) in August.
Check out our detailed temperature page for more information.
Temperature ranges by month
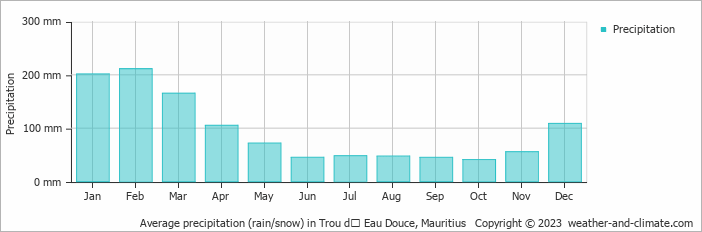
Rainfall in Trou dʼ Eau Douce
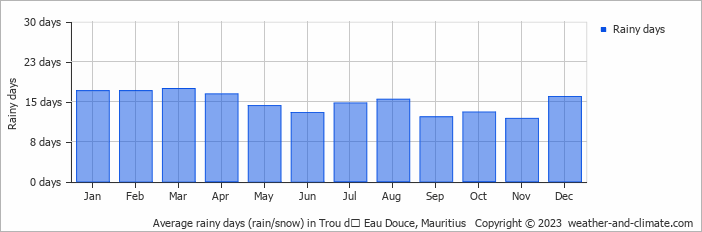
Trou dʼ Eau Douce has a relatively rainy climate with high precipitation levels, averaging 1145 mm (45 in) of rainfall annually. The seasons in Trou dʼ Eau Douce bring significant changes in precipitation. The wettest month, February, receives heavy rainfall, with an average of 211 mm (8.3 in) of precipitation. This rainfall is distributed across 17 rainy days.
In contrast, the driest month, October, experiences much less rainfall, totaling 41 mm (1.6 in) over 13 rainy days. These distinct seasonal differences provide diverse experiences throughout the year. For more details, please visit our Trou dʼ Eau Douce Precipitation page.
The mean monthly precipitation over the year, including rain, hail, and snow
The average number of days each month with precipitation
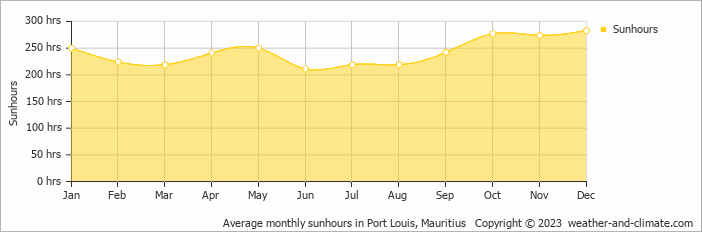
Sunshine Hours in Trou dʼ Eau Douce
Trou dʼ Eau Douce enjoys sunny spells year-round. December sees up to 9.4 hours of daily sunshine, perfect for a sunny trip. June, the least sunny month, still offers a generous 7.0 hours of sun despite this cloudier time of the year.
Visit our detailed sunshine hours page for more information.
Monthly hours of sunshine
Daily hours of sunshine
Trou dʼ Eau Douce 3-Day Forecast
Check the conditions for any month of the year.
Best Time to Visit Trou dʼ Eau Douce
During the months of May, June, July, August, September, October and November, Trou dʼ Eau Douce enjoys pleasant weather with average temperatures ranging from 24°C (75°F) to 27°C (80°F). These months are perfect for sightseeing and exploring.Rainfall during this time ranges from 41 mm (1.6 in) in October to 72 mm (2.8 in) in May. This means you can expect a mix of sunny days and occasional showers.
The rainy season falls during January, February and March, bringing heavy precipitation. Need help choosing your next travel destination? We offer a specialized tool that matches you with locations based on your weather preferences. Explore destinations that suit your climate preferences.


