Travancinha Weather & Climate: Best Time to Visit
Average temperatures, rainfall, sunshine and the best time to visit Travancinha.
Climate overview of Travancinha
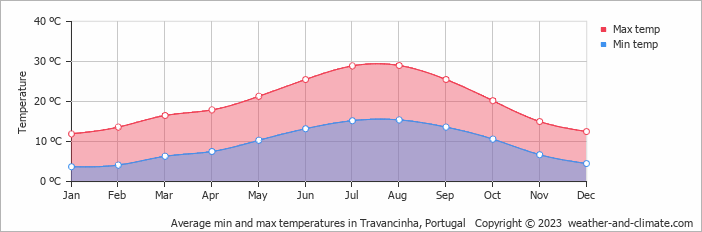
Temperatures in Travancinha, Centro Region, Portugal, vary greatly throughout the year. August is the hottest month at 29°C (84°F), while January is the coldest at 12°C (54°F).
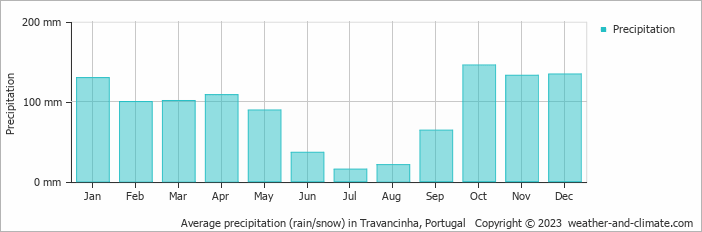
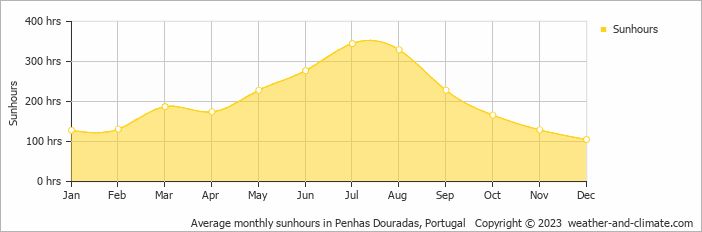
With around 1077 mm (42 in) of annual rainfall, Travancinha has a notably wet climate. However, this rainfall is not evenly distributed — the city has a distinct dry season from June to August. The wettest month is October. Sunshine peaks in July, when the city sees around 11.5 hours of sunshine per day.
Travancinha Weather by Month
Pick a month to see the average temperature, rainfall and sunshine in Travancinha — and find the best time to visit.
Monthly Temperature in Travancinha
The climate in Travancinha is known for significant temperature differences throughout the year, making the weather dynamic. Average daytime temperatures reach a comfortable 29°C (84°F) in August. In January, the coolest month of the year, temperatures drop to a chilly 12°C (54°F).
At night, temperatures range from around 15°C (59°F) in August to 4°C (39°F) in January.
Check out our detailed temperature page for more information.
Temperature ranges by month
Rainfall in Travancinha
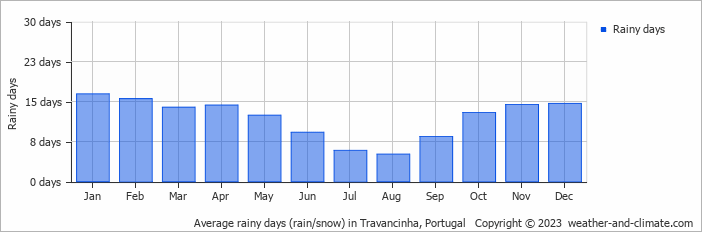
Travancinha has a notably wet climate with abundant precipitation, recording 1077 mm (42 in) of rainfall per year. Travancinha can be quite wet during October, receiving approximately 146 mm (5.7 in) of precipitation over 13 rainy days.
In contrast, during the driest month (July), you will experience much drier conditions, with 15 mm (0.6 in) of precipitation spread across 6 rainy days days. For more details, please visit our Travancinha Precipitation page.
The mean monthly precipitation over the year, including rain, hail, and snow
The average number of days each month with precipitation
Sunshine Hours in Travancinha
Travancinha can be enjoyed more throughout the sunniest month of July under a blue sky, with approximately 11.5 hours of sunshine daily. In contrast, the city experiences much darker days in December, with only 3.5 hours of sunlight per day.
Visit our detailed sunshine hours page for more information.
Monthly hours of sunshine
Daily hours of sunshine
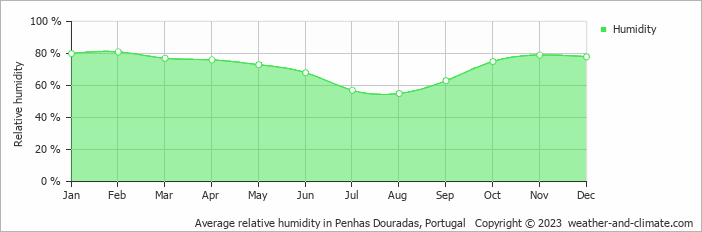
Humidity in Travancinha by Month
The relative humidity is high throughout the year in Travancinha.
The city experiences its highest humidity in February, reaching 81%. In August, the humidity drops to its lowest level at 55%. What does this mean? Read our detailed page on humidity levels for further details.
Relative humidity over the year
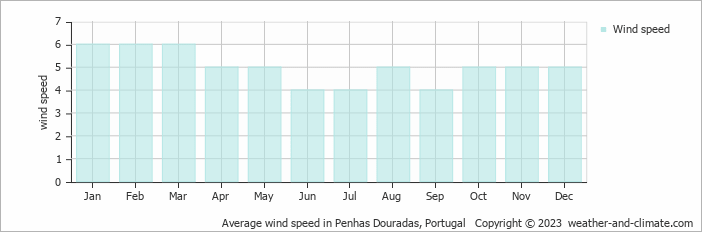
Wind Speed in Travancinha
The mean wind speed varies between 4 m/s (8 knots) and 6 m/s (12 knots) throughout the year. It is lowest in June, July and September and highest during January, February and March. What does this mean?
The mean monthly wind speed over the year (meters per second)
Best Time to Visit Travancinha
Frequently asked questions about the climate in Travancinha
What is the best time to visit Travancinha?
May, June, July, August and September typically offer the most optimal weather in Travancinha. In contrast, January and December tend to have less optimal conditions. Travancinha has a distinct dry season from June to August.
What temperatures can I expect in Travancinha?
Daytime highs range from 12°C (54°F) in January to 29°C (84°F) in August. Nighttime lows range from 4°C (39°F) to 15°C (59°F). Temperatures vary considerably through the year.
How much rain does Travancinha get?
Annual rainfall is around 1077 mm (42 in). October is the wettest month with 146 mm (5.7 in), while July is the driest with 15 mm (0.6 in).
How sunny is Travancinha?
Travancinha receives around 2,427 hours of sunshine per year. July is the sunniest month with 345 hours, while December is the cloudiest with just 105 hours. Overall, Travancinha enjoys abundant sunshine.
Travancinha 3-Day Forecast
Travancinha 3-Day Forecast
Travancinha on the map
Travancinha is highlighted — select any city to see its climate.
Popular this month
Where to go in July — average daytime high across popular destinations.
Bucket list
Need travel inspiration? Check out our bucket list articles and be inspired.
 7 of the most budget-friendly destinations in Europe
Discover Europe's top budget-friendly destinations including Budapest, Kotor, Krakow, and more, perfect for affordable and exciting travel.
 Alentejo, where time stands still
The quiet region is known for its rolling green hills and it is a true hiking paradise. Architectural highlights can be found in the castles, ancient monasteries or when exploring the countless charming villages.
An eco-friendly guide to Lagos travel
Lagos, Portugal is a great place to visit while being careful about your environmental footprint. Here you find some tips about environmentally places to stay, where to eat and how to get around in the area.
What to do in Lisbon: our tips for an unforgettable city trip
Lisbon is a bustling city with many special places. In this article you find the best sights, good restaurants and nice places to stay in Lisbon.