Straža Weather & Climate: Best Time to Visit
Average temperatures, rainfall, sunshine and the best time to visit Straža.
Climate overview of Straža
Straža, Dolenjska (Lower Carniola), Slovenia, sees big temperature differences between seasons, with July peaking at 27°C (81°F) and January dropping to 5°C (41°F).
The city receives considerable rain/snowfall, with around 1300 mm (51 in) annually. September is the wettest month. Sunshine peaks in July, when the city sees around 9.7 hours of sunshine per day.
Straža Weather by Month
Pick a month to see the average temperature, rainfall and sunshine in Straža — and find the best time to visit.
Monthly Temperature in Straža
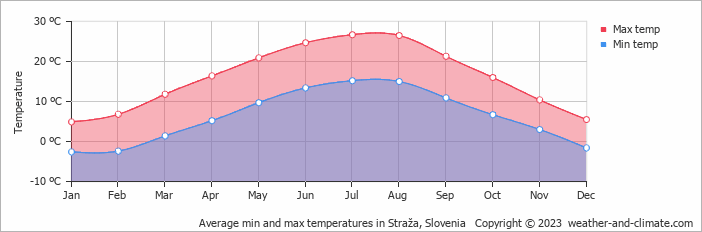
Visitors to Straža can expect significant temperature changes throughout the year. Typically, average maximum daytime temperatures range from a comfortable 27°C (81°F) in July to a chilly 5°C (41°F) in the coolest month, January.
Nights vary from 15°C (59°F) in July to around -3°C (27°F) during the colder months.
Check out our detailed temperature page for more information.
Temperature ranges by month
Rainfall in Straža
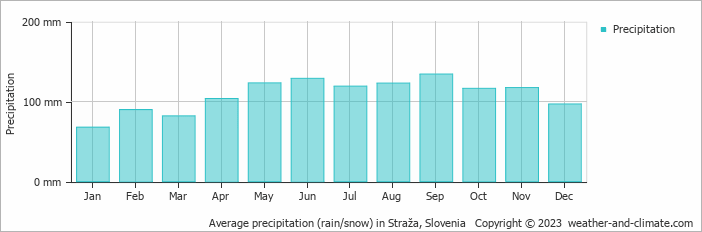
Straža is known for its substantial rain/snowfall, with annual precipitation reaching 1300 mm (51 in). Straža offers a pleasant mix of wetter and slightly drier months. The difference in precipitation between the wettest month September (134 mm (5.3 in)) and the driest month January (68 mm (2.7 in)) is not too significant. For more details, please visit our Straža Precipitation page.
The mean monthly precipitation over the year, including rain, hail, and snow
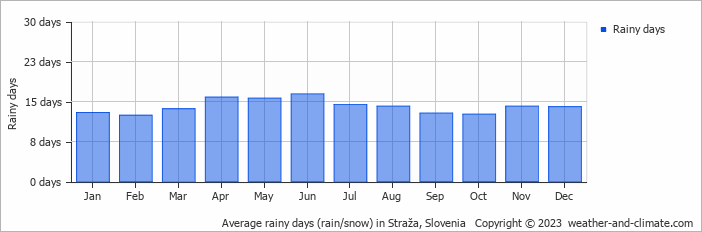
The average number of days each month with precipitation
Sunshine Hours in Straža
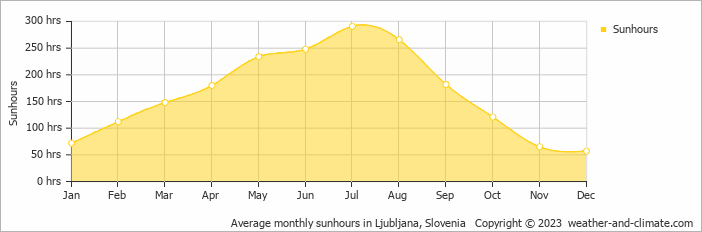
For those who appreciate different seasons, Straža serves as an ideal destination. Expect longer, more sun-filled days in July with an average of 9.7 hours of sunshine daily, and embrace the darker days in December, offering only 1.9 hours of daily sunlight.
Visit our detailed sunshine hours page for more information.
Monthly hours of sunshine
Daily hours of sunshine
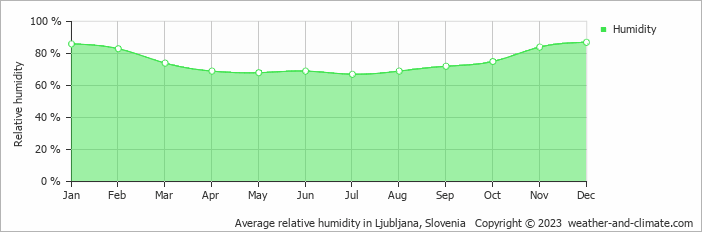
Humidity in Straža by Month
The relative humidity is high throughout the year in Straža.
The city experiences its highest humidity in December, reaching 87%. In July, the humidity drops to its lowest level at 67%. What does this mean? Read our detailed page on humidity levels for further details.
Relative humidity over the year
Best Time to Visit Straža
The weather does bring rainfall during this period, between 119 mm (4.7 in) and 134 mm (5.3 in). Planning your next adventure but unsure where to go? Our climate tool suggests perfect locations tailored to your preferred weather conditions. Discover your ideal travel destination with our weather planner.
Frequently asked questions about the climate in Straža
What is the best time to visit Straža?
May, June, July, August and September typically offer the most optimal weather in Straža. In contrast, January, February, November and December tend to have less optimal conditions.
What temperatures can I expect in Straža?
Daytime highs range from 5°C (41°F) in January to 27°C (81°F) in July. Nighttime lows range from -3°C (27°F) to 15°C (59°F). Temperatures vary considerably through the year.
How much rain does Straža get?
Annual rainfall is around 1300 mm (51 in). September is the wettest month with 134 mm (5.3 in), while January is the driest with 68 mm (2.7 in).
How sunny is Straža?
Straža receives around 1,976 hours of sunshine per year. July is the sunniest month with 291 hours, while December is the cloudiest with just 57 hours.
Straža 3-Day Forecast
Straža 3-Day Forecast
Straža on the map
Straža is highlighted — select any city to see its climate.
Popular this month
Where to go in July — average daytime high across popular destinations.
Bucket list
Need travel inspiration? Check out our bucket list articles and be inspired.
 Go to Bovec in Slovenia
With mountains that linger in the blue sky, an emerald-green river Bovec offers picturesque scenes that are a must see for your bucket list.
Experience Dazzling Fairy Tales In The Lake Bled Of Slovenia
Slovenia's most well-known tourist destination is Lake Bled, which is still relatively undiscovered when compared to other European attractions despite its growing notoriety.