São Gonçalo Weather & Climate: Best Time to Visit
Average temperatures, rainfall, sunshine and the best time to visit São Gonçalo.
Climate overview of São Gonçalo
The climate in São Gonçalo, Madeira Islands, Portugal, sees a moderate range of temperatures across the year, from 25°C (77°F) in August down to 17°C (63°F) in February.
The city receives around 503 mm (20 in) of rainfall per year. It experiences a distinct dry season from May to September. December is the wettest month and July the driest. Sunshine peaks in August, when the city sees around 7.9 hours of sunshine per day.
São Gonçalo Weather by Month
Pick a month to see the average temperature, rainfall and sunshine in São Gonçalo — and find the best time to visit.
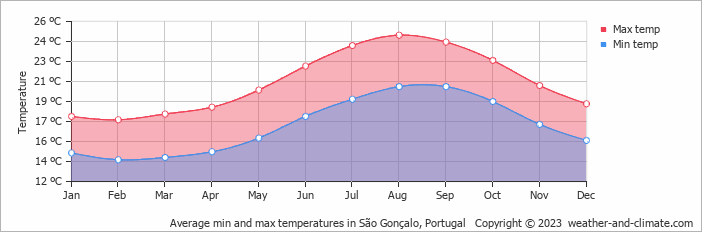
Monthly Temperature in São Gonçalo
The climate in São Gonçalo experiences moderate temperature changes, with mild shifts between seasons. On average, daytime temperatures range from a comfortable 25°C (77°F) in August to a moderate 17°C (63°F) in February.
Nighttime temperatures range from 20°C (68°F) in August to 14°C (57°F) in February.
Check out our detailed temperature page for more information.
Temperature ranges by month
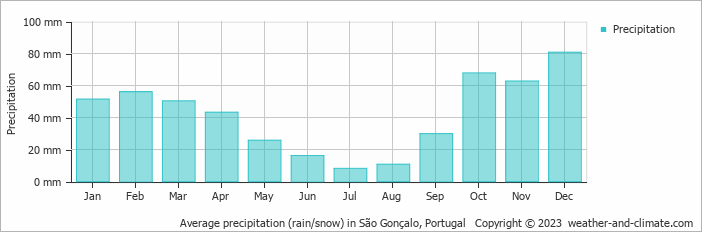
Rainfall in São Gonçalo
On average, São Gonçalo receives a reasonable amount of rainfall, with an annual precipitation of 503 mm (20 in). The seasons in São Gonçalo bring significant changes in precipitation. The wettest month, December, receives moderate rainfall, with an average of 81 mm (3.2 in) of precipitation. This rainfall is distributed across 12 rainy days.
In contrast, the driest month, July, experiences much less rainfall, totaling 8.1 mm (0.3 in) over 3 rainy days. These distinct seasonal differences provide diverse experiences throughout the year. For more details, please visit our São Gonçalo Precipitation page.
The mean monthly precipitation over the year, including rain, hail, and snow
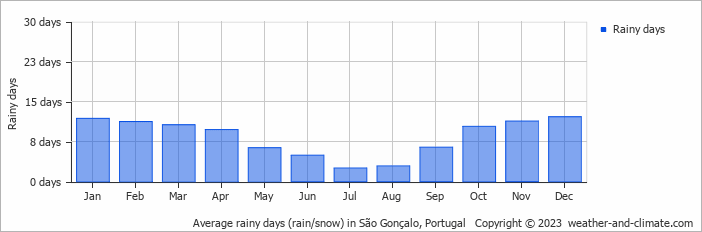
The average number of days each month with precipitation
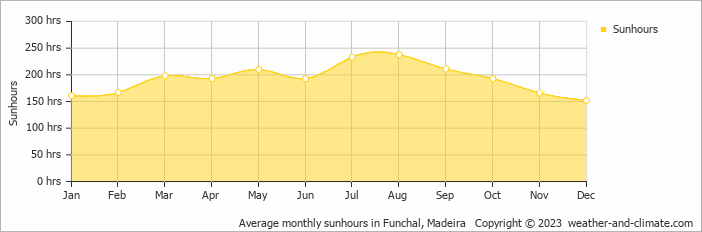
Sunshine Hours in São Gonçalo
São Gonçalo enjoys sunny spells year-round. August sees up to 7.9 hours of daily sunshine, perfect for a sunny trip. December, the least sunny month, still offers a generous 5.1 hours of sun despite this cloudier time of the year.
Visit our detailed sunshine hours page for more information.
Monthly hours of sunshine
Daily hours of sunshine
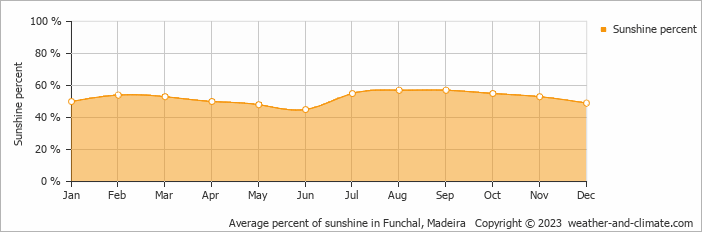
Daily percentage of sunshine
Water Temperature in São Gonçalo
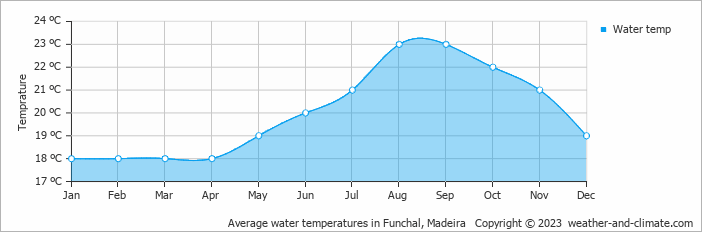
The mean water temperature over the year ranges from 18°C (64°F) in January to 23°C (73°F) in August.
Water temperature over the year
Humidity in São Gonçalo by Month
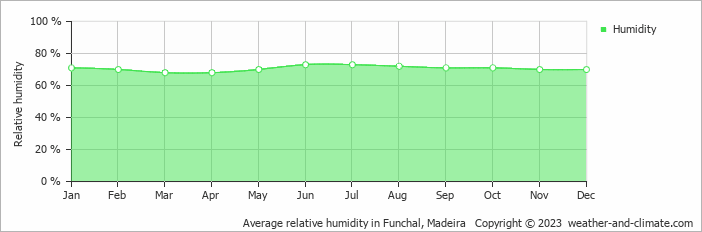
The relative humidity is high throughout the year in São Gonçalo.
The city experiences its highest humidity in June, reaching 73%. In March, the humidity drops to its lowest level at 68%. What does this mean? Read our detailed page on humidity levels for further details.
Relative humidity over the year
Wind Speed in São Gonçalo
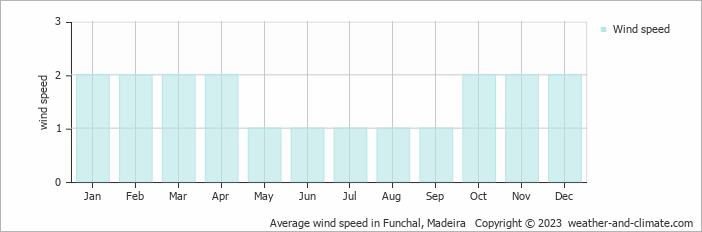
The mean wind speed over the year ranges from 1 m/s (2 knots) in May, June, July, August and September to 2 m/s (4 knots) in January, February, March, April, October, November and December. What does this mean?
The mean monthly wind speed over the year (meters per second)
Best Time to Visit São Gonçalo
Frequently asked questions about the climate in São Gonçalo
What is the best time to visit São Gonçalo?
May, June, July, August, September, October and November typically offer the most optimal weather in São Gonçalo. In contrast, February tends to have less optimal conditions. São Gonçalo has a distinct dry season from May to September.
What temperatures can I expect in São Gonçalo?
Daytime highs range from 17°C (63°F) in February to 25°C (77°F) in August. Nighttime lows range from 14°C (57°F) to 20°C (68°F).
How much rain does São Gonçalo get?
Annual rainfall is around 503 mm (20 in). December is the wettest month with 81 mm (3.2 in), while July is the driest with 8.1 mm (0.3 in).
How sunny is São Gonçalo?
São Gonçalo receives around 2,315 hours of sunshine per year. August is the sunniest month with 238 hours, while December is the cloudiest with just 152 hours. Overall, São Gonçalo enjoys abundant sunshine.
São Gonçalo 3-Day Forecast
São Gonçalo 3-Day Forecast
São Gonçalo on the map
São Gonçalo is highlighted — select any city to see its climate.
Popular this month
Where to go in July — average daytime high across popular destinations.
Bucket list
Need travel inspiration? Check out our bucket list articles and be inspired.
 7 of the most budget-friendly destinations in Europe
Discover Europe's top budget-friendly destinations including Budapest, Kotor, Krakow, and more, perfect for affordable and exciting travel.
 Alentejo, where time stands still
The quiet region is known for its rolling green hills and it is a true hiking paradise. Architectural highlights can be found in the castles, ancient monasteries or when exploring the countless charming villages.
An eco-friendly guide to Lagos travel
Lagos, Portugal is a great place to visit while being careful about your environmental footprint. Here you find some tips about environmentally places to stay, where to eat and how to get around in the area.
What to do in Lisbon: our tips for an unforgettable city trip
Lisbon is a bustling city with many special places. In this article you find the best sights, good restaurants and nice places to stay in Lisbon.