Roches Noires Weather & Climate: Best Time to Visit
Roches Noires, Mauritius, enjoys a steady climate throughout the year, with daytime temperatures typically around 27°C (81°F). February is the warmest month at 29°C (84°F), while August is the coolest at 24°C (75°F).
With around 985 mm (39 in) of annual rainfall, the city has moderate precipitation levels. February is the wettest month and October the driest. It also has a distinct dry season from June to October. The most sunshine falls in December, with an average of 9.4 hours of daily sunshine.
Monthly Temperature in Roches Noires
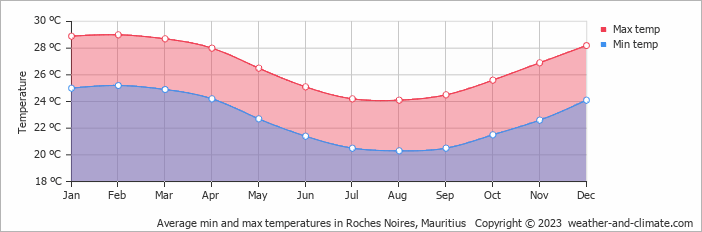
The temperature in Roches Noires remains steady throughout the year, providing a consistently comfortable climate. Typically, average maximum daytime temperatures range from a comfortable 29°C (84°F) in February to a comfortable 24°C (75°F) in the coolest month, August.
Nights vary from 25°C (77°F) in February to around 20°C (68°F) during the colder months.
Check out our detailed temperature page for more information.
Temperature ranges by month
Rainfall in Roches Noires
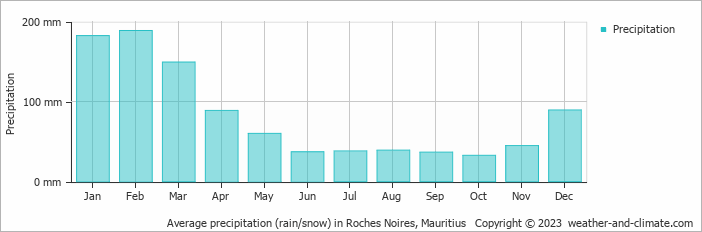
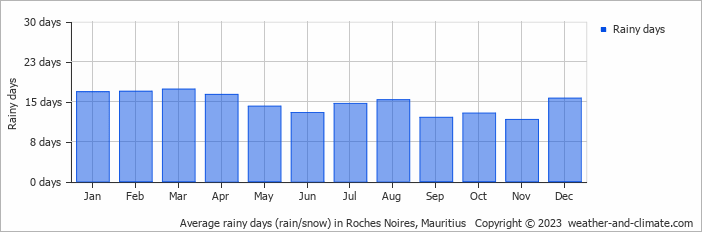
Generally, Roches Noires has a moderate amount of precipitation, averaging 985 mm (39 in) of rainfall annually. The climate in Roches Noires shows significant variation throughout the year. Expect heavy rainfall in February, the wettest month, with an average of 189 mm (7.4 in) of precipitation over 17 rainy days.
In contrast, the driest month October offers drier and sunnier days, with around 33 mm (1.3 in) of rainfall over 13 rainy days. For more details, please visit our Roches Noires Precipitation page.
The mean monthly precipitation over the year, including rain, hail, and snow
The average number of days each month with precipitation
Sunshine Hours in Roches Noires
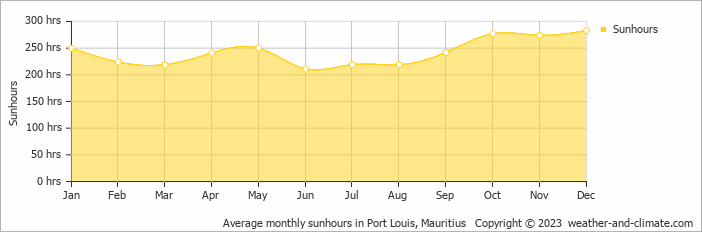
Roches Noires offers a pleasant mix of sunny and slightly overcast days. The difference in sunshine hours between December (9.4 hours daily) and June (7.0 hours daily) provides a bit of variety for visitors and residents.
Visit our detailed sunshine hours page for more information.
Monthly hours of sunshine
Daily hours of sunshine
Roches Noires 3-Day Forecast
Check the conditions for any month of the year.
Best Time to Visit Roches Noires
During the months of May, June, July, August, September, October and November, Roches Noires enjoys pleasant weather with average temperatures ranging from 24°C (75°F) to 27°C (80°F). These months are perfect for sightseeing and exploring.Rainfall during this time ranges from 33 mm (1.3 in) in October to 60 mm (2.4 in) in May. This means you can expect a mix of sunny days and occasional showers.
The rainy season falls during January and February, bringing heavy precipitation. Ready to plan your travels but need destination ideas? Our smart tool recommends places based on the climate conditions you prefer. Start planning with our destination weather tool.


