Raška Weather & Climate: Best Time to Visit
Average temperatures, rainfall, sunshine and the best time to visit Raška.
Climate overview of Raška
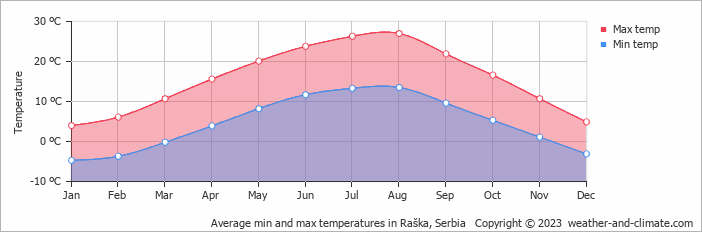
Raška, Central Serbia, Serbia, sees big temperature differences between seasons, with August peaking at 27°C (81°F) and January dropping to 4°C (39°F).
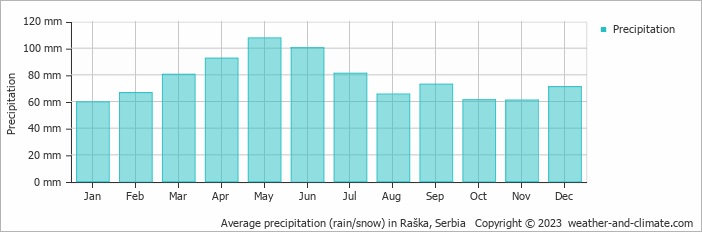
Annual rain/snowfall is moderate at around 919 mm (36 in), with May being the wettest month.
Raška Weather by Month
Pick a month to see the average temperature, rainfall and sunshine in Raška — and find the best time to visit.
Monthly Temperature in Raška
Visitors to Raška can expect significant temperature changes throughout the year. Average daytime temperatures reach a comfortable 27°C (81°F) in August. In January, the coolest month of the year, temperatures drop to a chilly 4°C (39°F).
At night, temperatures range from around 14°C (57°F) in August to -5°C (23°F) in January.
Check out our detailed temperature page for more information.
Temperature ranges by month
Rainfall in Raška
Generally, Raška experiences moderate precipitation patterns, averaging 919 mm (36 in) yearly. Raška experiences moderate seasonal variation in rainfall, with monthly averages ranging from 108 mm (4.3 in) in May, the wettest month, and 60 mm (2.4 in) in January, the driest month. For more details, please visit our Raška Precipitation page.
The mean monthly precipitation over the year, including rain, hail, and snow
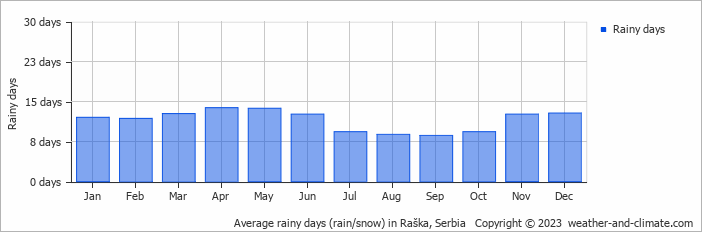
The average number of days each month with precipitation
Best Time to Visit Raška
The weather does bring rainfall during this period, between 66 mm (2.6 in) and 108 mm (4.3 in). Wondering where to travel based on your weather preferences? Our recommendation tool helps you find destinations with your ideal climate conditions. Use our weather planner to find your perfect destination.
Frequently asked questions about the climate in Raška
What is the best time to visit Raška?
July, August and September typically offer the most optimal weather in Raška. In contrast, January, February and December tend to have less optimal conditions.
What temperatures can I expect in Raška?
Daytime highs range from 4°C (39°F) in January to 27°C (81°F) in August. Nighttime lows range from -5°C (23°F) to 14°C (57°F). Temperatures vary considerably through the year.
How much rain does Raška get?
Annual rainfall is around 919 mm (36 in). May is the wettest month with 108 mm (4.3 in), while January is the driest with 60 mm (2.4 in).
Raška 3-Day Forecast
Raška 3-Day Forecast
Raška on the map
Raška is highlighted — select any city to see its climate.
Popular this month
Where to go in July — average daytime high across popular destinations.
Bucket list
Need travel inspiration? Check out our bucket list articles and be inspired.
