Qulaybīyah Weather & Climate: Best Time to Visit
Average temperatures, rainfall, sunshine and the best time to visit Qulaybīyah.
Climate overview of Qulaybīyah
Qulaybīyah, Tunisia, sees big temperature differences between seasons, with August peaking at 29°C (84°F) and February dropping to 16°C (61°F).
The city has a relatively dry climate, receiving around 489 mm (19 in) of rainfall per year. It does experience a distinct dry season from April to August. October is the wettest month and July the driest.
Qulaybīyah Weather by Month
Pick a month to see the average temperature, rainfall and sunshine in Qulaybīyah — and find the best time to visit.
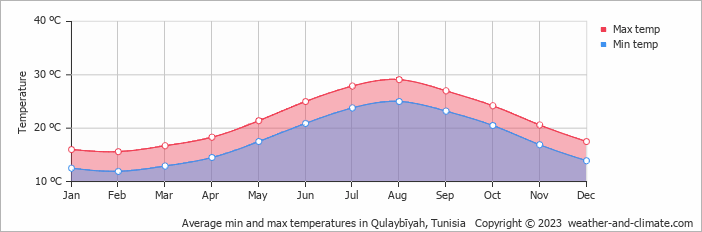
Monthly Temperature in Qulaybīyah
Visitors to Qulaybīyah can expect significant temperature changes throughout the year. On average, daytime temperatures range from a comfortable 29°C (84°F) in August to a moderate 16°C (61°F) in February.
Nighttime temperatures range from 25°C (77°F) in August to 12°C (54°F) in February.
Check out our detailed temperature page for more information.
Temperature ranges by month
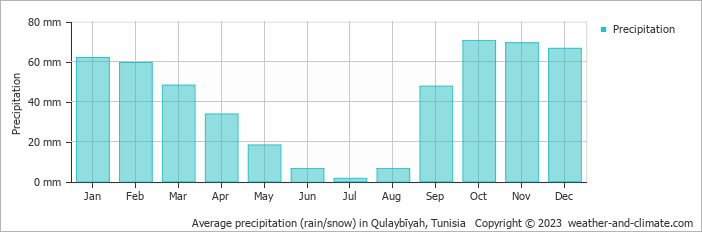
Rainfall in Qulaybīyah
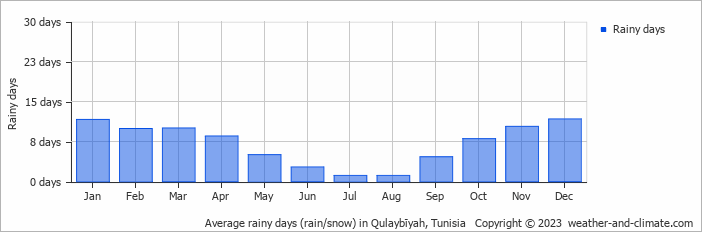
Qulaybīyah tends toward drier weather patterns, receiving approximately 489 mm (19 in) of rain per year. The seasons in Qulaybīyah bring significant changes in precipitation. The wettest month, October, receives moderate rainfall, with an average of 70 mm (2.8 in) of precipitation. This rainfall is distributed across 8 rainy days.
In contrast, the driest month, July, experiences much less rainfall, totaling 1.5 mm (0.1 in) over a single rainy day. These distinct seasonal differences provide diverse experiences throughout the year. For more details, please visit our Qulaybīyah Precipitation page.
The mean monthly precipitation over the year, including rain, hail, and snow
The average number of days each month with precipitation
Best Time to Visit Qulaybīyah
The weather does bring rainfall during this period, between 6 mm (0.2 in) and 70 mm (2.8 in). Seeking the perfect travel destination for this year? We've created a tool that suggests locations matching your desired weather. Let our weather planner guide your travel decisions.
Frequently asked questions about the climate in Qulaybīyah
What is the best time to visit Qulaybīyah?
May, June, July, August, September, October and November typically offer the most optimal weather in Qulaybīyah. In contrast, January, February and March tend to have less optimal conditions. Qulaybīyah has a distinct dry season from April to August.
What temperatures can I expect in Qulaybīyah?
Daytime highs range from 16°C (61°F) in February to 29°C (84°F) in August. Nighttime lows range from 12°C (54°F) to 25°C (77°F). Temperatures vary considerably through the year.
How much rain does Qulaybīyah get?
Annual rainfall is around 489 mm (19 in). October is the wettest month with 70 mm (2.8 in), while July is the driest with 1.5 mm (0.1 in).
Qulaybīyah 3-Day Forecast
Qulaybīyah 3-Day Forecast
Qulaybīyah on the map
Qulaybīyah is highlighted — select any city to see its climate.
Popular this month
Where to go in July — average daytime high across popular destinations.
Bucket list
Need travel inspiration? Check out our bucket list articles and be inspired.