Puerto Iguazú Weather & Climate: Best Time to Visit
Average temperatures, rainfall, sunshine and the best time to visit Puerto Iguazú.
Climate overview of Puerto Iguazú
Puerto Iguazú Weather by Month
Pick a month to see the average temperature, rainfall and sunshine in Puerto Iguazú — and find the best time to visit.
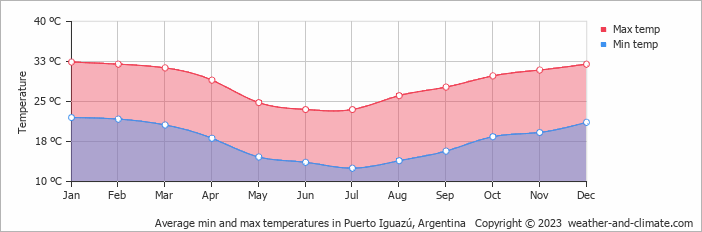
Monthly Temperature in Puerto Iguazú
In Puerto Iguazú, seasonal changes bring about a moderate variation in temperatures. Average daytime temperatures reach a very warm 32°C (90°F) in January. In July, the coolest month of the year, temperatures drop to a comfortable 24°C (75°F).
At night, temperatures range from around 22°C (72°F) in January to 13°C (55°F) in July.
Check out our detailed temperature page for more information.
Temperature ranges by month
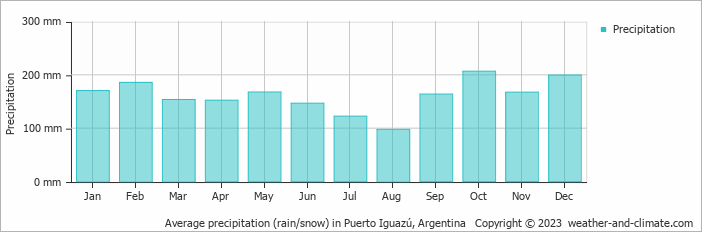
Rainfall in Puerto Iguazú
Puerto Iguazú has a relatively rainy climate with high precipitation levels, averaging 1932 mm (76 in) of rainfall annually. Puerto Iguazú experiences moderate seasonal variation in rainfall, with monthly averages ranging from 207 mm (8.1 in) in October, the wettest month, and 97 mm (3.8 in) in August, the driest month. For more details, please visit our Puerto Iguazú Precipitation page.
The mean monthly precipitation over the year, including rain, hail, and snow
The average number of days each month with precipitation

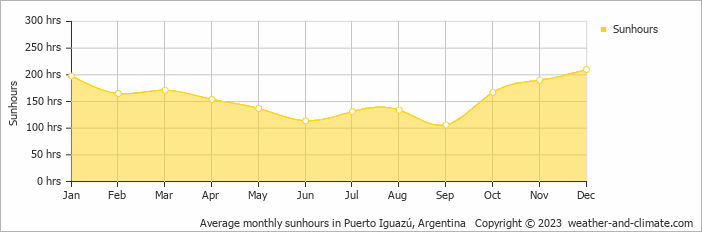
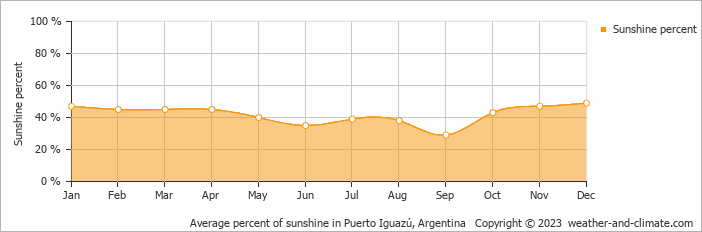
Sunshine Hours in Puerto Iguazú
Puerto Iguazú can be enjoyed more throughout the sunniest month of December under a blue sky, with approximately 7.0 hours of sunshine daily. In contrast, the city experiences much darker days in September, with only 3.5 hours of sunlight per day.
Visit our detailed sunshine hours page for more information.
Monthly hours of sunshine
Daily hours of sunshine
Daily percentage of sunshine
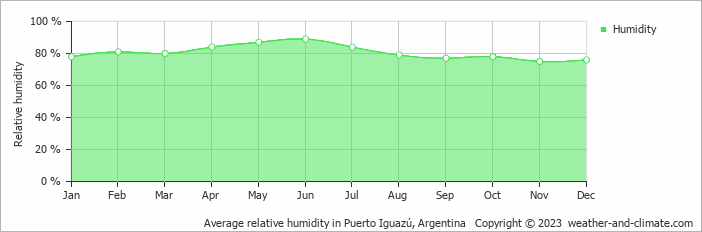
Humidity in Puerto Iguazú by Month
The city experiences its highest humidity in June, reaching 89%. In November, the humidity drops to its lowest level at 75%. What does this mean? Read our detailed page on humidity levels for further details.
Relative humidity over the year
Best Time to Visit Puerto Iguazú
Rainfall during this time ranges from 97 mm (3.8 in) in August to 147 mm (5.8 in) in June. This means you can expect a mix of sunny days and occasional showers.
The rainy season falls during January, February, May, September, October, November and December, bringing heavy precipitation. Planning your next adventure but unsure where to go? Our climate tool suggests perfect locations tailored to your preferred weather conditions. Discover your ideal travel destination with our weather planner.
Frequently asked questions about the climate in Puerto Iguazú
What is the best time to visit Puerto Iguazú?
August typically offers the most optimal weather in Puerto Iguazú. In contrast, February, October and December tend to have less optimal conditions. Puerto Iguazú has a distinct rainy season from December to February.
What temperatures can I expect in Puerto Iguazú?
Daytime highs range from 24°C (75°F) in July to 32°C (90°F) in January. Nighttime lows range from 13°C (55°F) to 22°C (72°F).
How much rain does Puerto Iguazú get?
Annual rainfall is around 1932 mm (76 in). October is the wettest month with 207 mm (8.1 in), while August is the driest with 97 mm (3.8 in).
How sunny is Puerto Iguazú?
Puerto Iguazú receives around 1,877 hours of sunshine per year. December is the sunniest month with 210 hours, while September is the cloudiest with just 106 hours.
Puerto Iguazú 3-Day Forecast
Puerto Iguazú 3-Day Forecast
Puerto Iguazú on the map
Puerto Iguazú is highlighted — select any city to see its climate.
Popular this month
Where to go in June — average daytime high across popular destinations.
Bucket list
Need travel inspiration? Check out our bucket list articles and be inspired.
 Iguazu Falls
Iguazu Falls are among the largest waterfalls on earth. You will be speechless when you see this miracle of mother nature. They are included in the World Heritage List and have also been named one of the seven wonders of the world.
Be amazed by Buenos Aires
The city of beautiful museums, cute streets, green parks, lots of good food, interesting local neighborhoods and impressive historical buildings.
Explore Patagonia
A tour through Patagonia brings you to the end of the world. That’s why Patagonia is a bucket list destination for many. We recommend to visit Patagonia from November to early March.
Glacier walk on The Perito Moreno glacier
The Perito Moreno glacier and the rupture of this glacier is considered one of the most impressive natural spectacles in the world. You can wait here until a large piece of ice crumbles and plunges into the water with a lot of noise.