Poraj Weather & Climate: Best Time to Visit
Average temperatures, rainfall, sunshine and the best time to visit Poraj.
Climate overview of Poraj
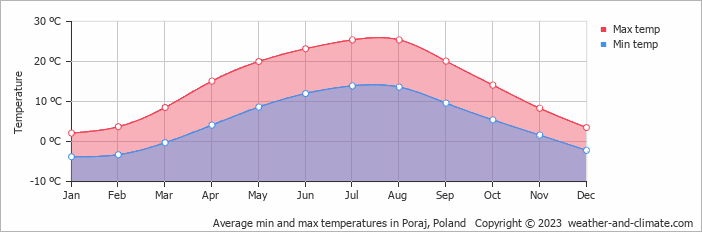
Poraj, Poland, experiences significant temperature variation throughout the year. Summers bring daytime highs of 25°C (77°F) in July, while winters cool to 2°C (36°F) in January.
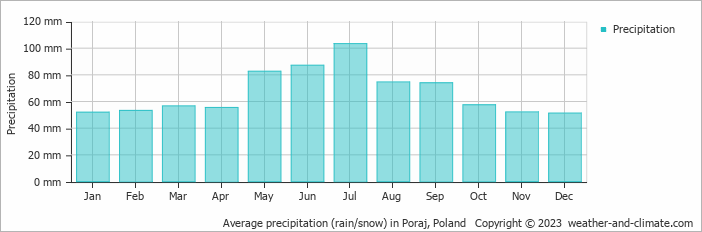
Annual rain/snowfall is moderate at around 799 mm (31 in), with July being the wettest month.
Poraj Weather by Month
Pick a month to see the average temperature, rainfall and sunshine in Poraj — and find the best time to visit.
Monthly Temperature in Poraj
Depending on the time of the year, temperatures range from comfortable to chilly in Poraj. Average daytime temperatures reach a comfortable 25°C (77°F) in July. In January, the coolest month of the year, temperatures drop to a chilly 2°C (36°F).
At night, temperatures range from around 14°C (57°F) in July to -4°C (25°F) in January.
Check out our detailed temperature page for more information.
Temperature ranges by month
Rainfall in Poraj
Generally, Poraj has a moderate amount of precipitation, averaging 799 mm (31 in) of rain/snowfall annually. Poraj experiences moderate seasonal variation in rainfall, with monthly averages ranging from 103 mm (4.1 in) in July, the wettest month, and 51 mm (2 in) in December, the driest month. For more details, please visit our Poraj Precipitation page.
The mean monthly precipitation over the year, including rain, hail, and snow
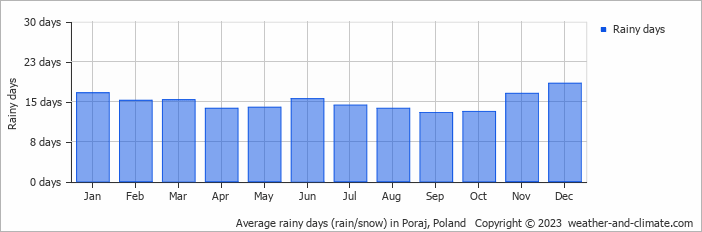
The average number of days each month with precipitation
Humidity in Poraj by Month
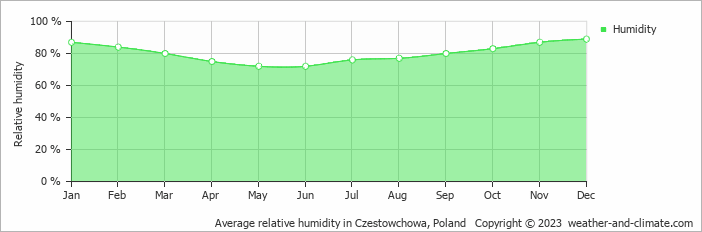
The city experiences its highest humidity in December, reaching 89%. In May, the humidity drops to its lowest level at 72%. What does this mean? Read our detailed page on humidity levels for further details.
Relative humidity over the year
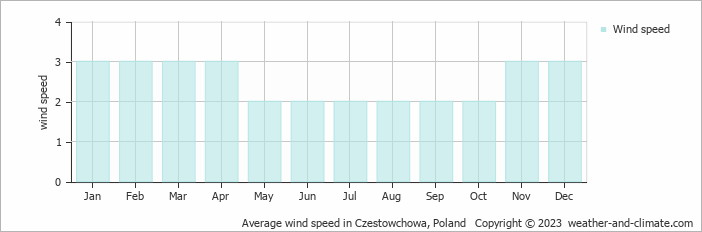
Wind Speed in Poraj
The mean wind speed over the year ranges from 2 m/s (4 knots) in May, June, July, August, September and October to 3 m/s (6 knots) in January, February, March, April, November and December. What does this mean?
The mean monthly wind speed over the year (meters per second)
Best Time to Visit Poraj
Rainfall during this time ranges from 74 mm (2.9 in) in September to 103 mm (4.1 in) in July. This means you can expect a mix of sunny days and occasional showers. Planning your next adventure but unsure where to go? Our climate tool suggests perfect locations tailored to your preferred weather conditions. Discover your ideal travel destination with our weather planner.
Frequently asked questions about the climate in Poraj
What is the best time to visit Poraj?
May, June, August and September typically offer the most optimal weather in Poraj. In contrast, January, February, March, November and December tend to have less optimal conditions.
What temperatures can I expect in Poraj?
Daytime highs range from 2°C (36°F) in January to 25°C (77°F) in July. Nighttime lows range from -4°C (25°F) to 14°C (57°F). Temperatures vary considerably through the year.
How much rain does Poraj get?
Annual rainfall is around 799 mm (31 in). July is the wettest month with 103 mm (4.1 in), while December is the driest with 51 mm (2 in).
Poraj 3-Day Forecast
Poraj 3-Day Forecast
Poraj on the map
Poraj is highlighted — select any city to see its climate.
Popular this month
Where to go in July — average daytime high across popular destinations.
Bucket list
Need travel inspiration? Check out our bucket list articles and be inspired.
 7 of the most budget-friendly destinations in Europe
Discover Europe's top budget-friendly destinations including Budapest, Kotor, Krakow, and more, perfect for affordable and exciting travel.
 Bialowieza, the Last Primeval Forest
Being the last remaining segment of the once sprawling lowland forest that covered Europe, Bialowieza stands as the final stronghold of true wilderness on the continent.