Pitalito Weather & Climate: Best Time to Visit
The climate in Pitalito, Colombia, is remarkably consistent, with temperatures year-round averaging 24°C (75°F). The warmest month is November at 25°C (77°F), and the coolest is August at 22°C (72°F).
The city receives considerable rainfall, with around 2751 mm (108 in) annually. April is the wettest month. Sunshine peaks in January, when the city sees around 5.3 hours of sunshine per day.
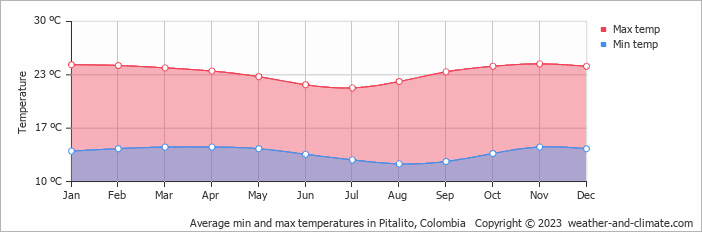
Monthly Temperature in Pitalito
In Pitalito temperatures are generally consistent throughout the year. Typically, average maximum daytime temperatures range from a comfortable 25°C (77°F) in November to a pleasant 22°C (72°F) in the coolest month, August.
Nights vary from 14°C (57°F) in November to around 12°C (54°F) during the colder months.
Check out our detailed temperature page for more information.
Temperature ranges by month
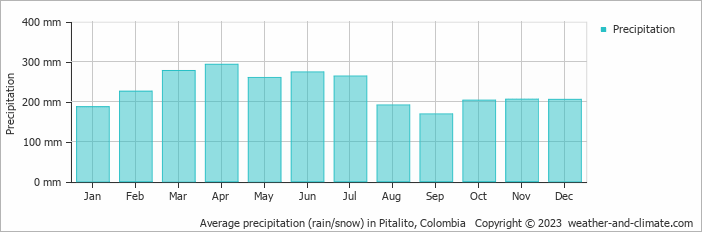
Rainfall in Pitalito
Pitalito experiences significant rainfall throughout the year, averaging 2751 mm (108 in) of precipitation annually. Pitalito offers a pleasant mix of wetter and slightly drier months. The difference in precipitation between the wettest month April (293 mm (12 in)) and the driest month September (169 mm (6.7 in)) is not too significant. For more details, please visit our Pitalito Precipitation page.
The mean monthly precipitation over the year, including rain, hail, and snow
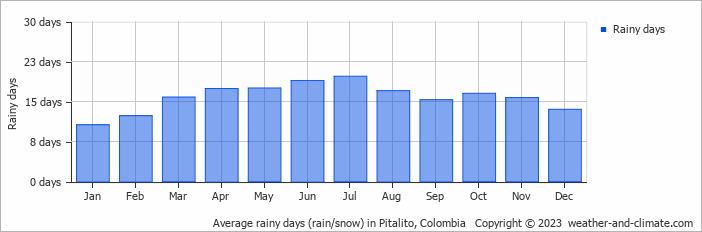
The average number of days each month with precipitation
Sunshine Hours in Pitalito
For those who appreciate different seasons, Pitalito serves as an ideal destination. Expect longer, more sun-filled days in January with an average of 5.3 hours of sunshine daily, and embrace the darker days in April, offering only 2.7 hours of daily sunlight.
Visit our detailed sunshine hours page for more information.
Monthly hours of sunshine
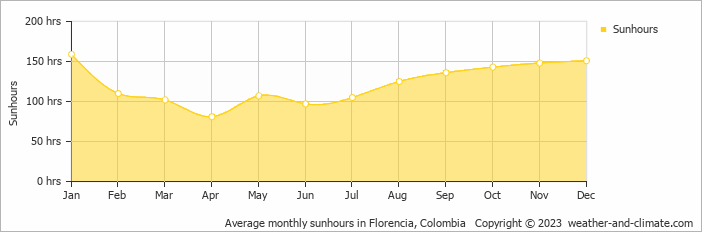
Daily hours of sunshine
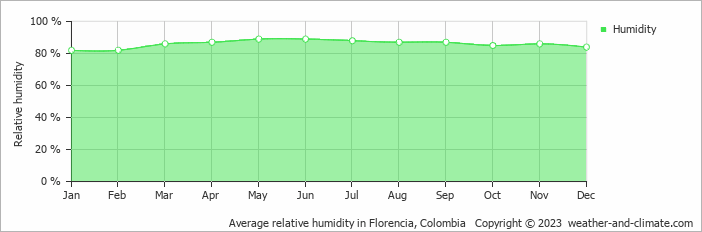
Humidity in Pitalito by Month
The city experiences its highest humidity in May, reaching 89%. In January, the humidity drops to its lowest level at 82%. What does this mean? Read our detailed page on humidity levels for further details.
Relative humidity over the year
Pitalito 3-Day Forecast
Check the conditions for any month of the year.
Best Time to Visit Pitalito
Throughout the year, Pitalito receives heavy precipitation with no month falling below 160 mm (6.3 in) of rainfall. This creates a perpetually wet climate with consistent rain patterns. The relatively driest month is September with 169 mm (6.7 in), though this still represents significant rainfall.Visitors should come prepared for wet weather regardless of when they visit, bring a poncho or umbrella. Wondering where to travel based on your weather preferences? Our recommendation tool helps you find destinations with your ideal climate conditions. Use our weather planner to find your perfect destination.


