Osøyro Weather & Climate: Best Time to Visit
Average temperatures, rainfall, sunshine and the best time to visit Osøyro.
Climate overview of Osøyro
Temperatures in Osøyro, Hordaland, Norway, vary greatly throughout the year. July is the hottest month at 19°C (66°F), while February is the coldest at 4°C (39°F).
With around 2559 mm (101 in) of annual rain/snowfall, Osøyro has a notably wet climate. The wettest month is December. Sunshine peaks in June, when the city sees around 6.4 hours of sunshine per day.
Osøyro Weather by Month
Pick a month to see the average temperature, rainfall and sunshine in Osøyro — and find the best time to visit.
Monthly Temperature in Osøyro
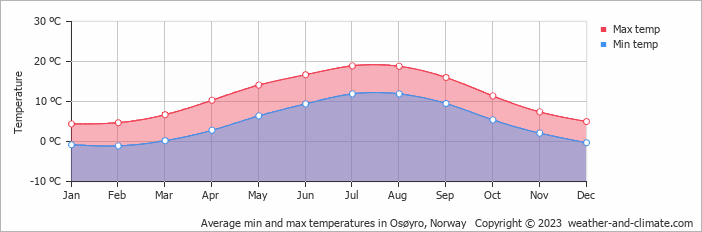
The climate in Osøyro is known for significant temperature differences throughout the year, making the weather dynamic. Average daytime temperatures reach a pleasant 19°C (66°F) in July. In February, the coolest month of the year, temperatures drop to a chilly 4°C (39°F).
At night, temperatures range from around 12°C (54°F) in July to -1°C (30°F) in February.
Check out our detailed temperature page for more information.
Temperature ranges by month
Rainfall in Osøyro
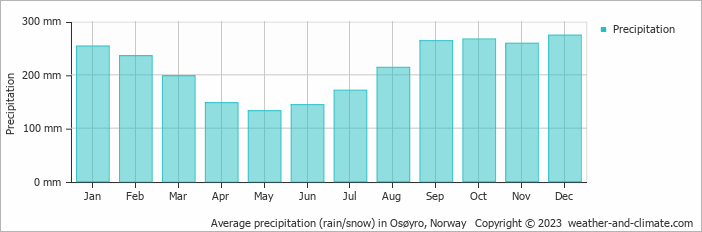
Osøyro has a notably wet climate with abundant precipitation, recording 2559 mm (101 in) of rain/snowfall per year. Osøyro experiences moderate seasonal variation in snow/rainfall, with monthly averages ranging from 274 mm (11 in) in December, the wettest month, and 132 mm (5.2 in) in May, the driest month. For more details, please visit our Osøyro Precipitation page.
The mean monthly precipitation over the year, including rain, hail, and snow
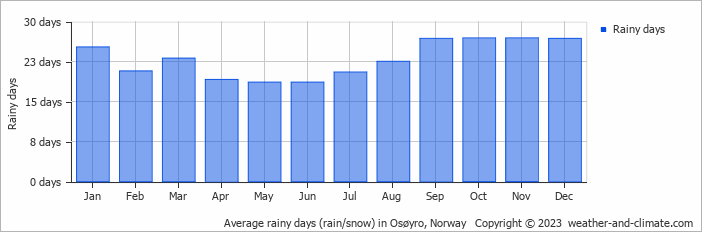
The average number of days each month with precipitation
Sunshine Hours in Osøyro
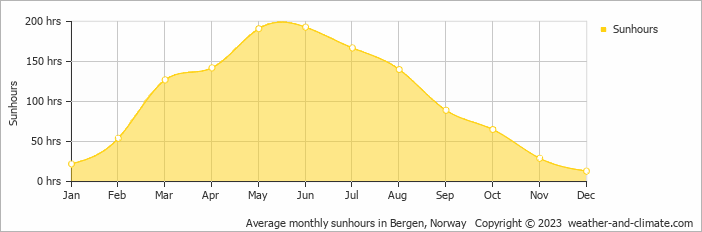
Osøyro can be enjoyed more throughout the sunniest month of June under a blue sky, with approximately 6.4 hours of sunshine daily. In contrast, the city experiences much darker days in December, with only 0.4 hours of sunlight per day.
Visit our detailed sunshine hours page for more information.
Monthly hours of sunshine
Daily hours of sunshine
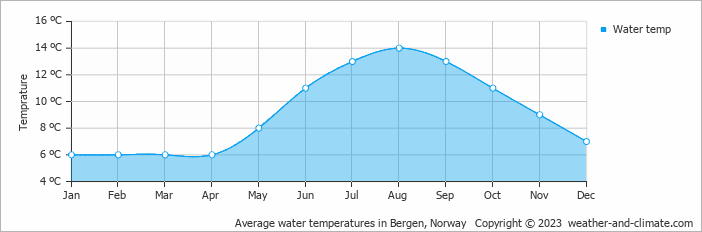
Water Temperature in Osøyro
The mean water temperature over the year ranges from 6°C (43°F) in January to 14°C (57°F) in August.
Water temperature over the year
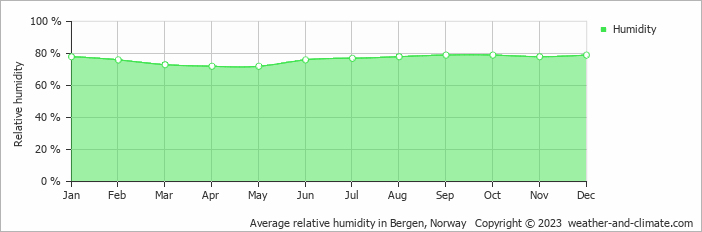
Humidity in Osøyro by Month
The relative humidity is high throughout the year in Osøyro.
The city experiences its highest humidity in September, reaching 79%. In April, the humidity drops to its lowest level at 72%. What does this mean? Read our detailed page on humidity levels for further details.
Relative humidity over the year
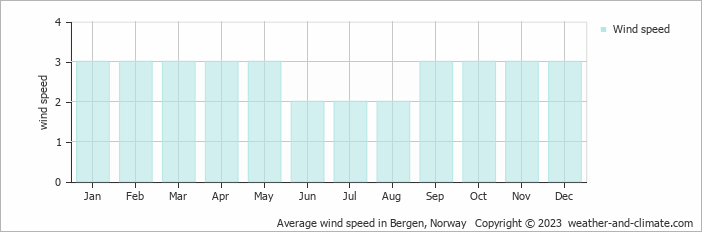
Wind Speed in Osøyro
The mean wind speed over the year ranges from 2 m/s (4 knots) in June, July and August to 3 m/s (6 knots) in January, February, March, April, May, September, October, November and December. What does this mean?
The mean monthly wind speed over the year (meters per second)
Best Time to Visit Osøyro
Frequently asked questions about the climate in Osøyro
What is the best time to visit Osøyro?
July typically offers the most optimal weather in Osøyro. In contrast, January, February, March, April, August, September, October, November and December tend to have less optimal conditions.
What temperatures can I expect in Osøyro?
Daytime highs range from 4°C (39°F) in February to 19°C (66°F) in July. Nighttime lows range from -1°C (30°F) to 12°C (54°F). Temperatures vary considerably through the year.
How much rain does Osøyro get?
Annual rainfall is around 2559 mm (101 in). December is the wettest month with 274 mm (11 in), while May is the driest with 132 mm (5.2 in). In the coldest months, precipitation may fall as snow/rain.
How sunny is Osøyro?
Osøyro receives around 1,232 hours of sunshine per year. June is the sunniest month with 193 hours, while December is the cloudiest with just 13 hours.
Osøyro 3-Day Forecast
Osøyro 3-Day Forecast
Osøyro on the map
Osøyro is highlighted — select any city to see its climate.
Popular this month
Where to go in July — average daytime high across popular destinations.
Bucket list
Need travel inspiration? Check out our bucket list articles and be inspired.
 The rugged landscape of the Norwegian fjords
This landscape is rated as the most beautiful in the world and it is something you need to experience at least once in your life.
Discover Norway's Hidden Gem: The Littleisland Lighthouse
Explore Littleisland Lighthouse in Norway - a serene getaway offering unique stays, breathtaking views, and a journey into tranquil simplicity.
The Majestic Geirangerfjord: Norway's Crown Jewel
Explore Norway's stunning Geirangerfjord, famous for its dramatic cliffs, waterfalls, and scenic routes. Breathtaking landscapes and outdoor adventures
Swimming with orcas in Norway
The best travel period to travel to Norway for the orcas are the months October, November December, January and February. Swimming with orcas in Norway might be the bucket list trip of your life.