Omura Weather & Climate: Best Time to Visit
Average temperatures, rainfall, sunshine and the best time to visit Omura.
Climate overview of Omura
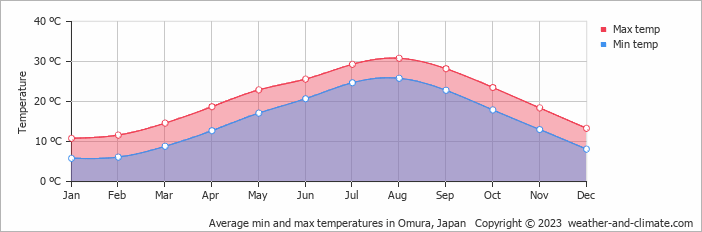
The climate in Omura, Nagasaki, Japan, is marked by large temperature swings across the seasons, ranging from 31°C (88°F) in August to 11°C (52°F) in January.
The city has a wet climate, receiving around 2074 mm (82 in) of rainfall per year. Despite the high annual total, it has a distinct rainy season from May to September. June is the wettest month. Sunshine peaks in August, when the city sees around 7.0 hours of sunshine per day.
Omura Weather by Month
Pick a month to see the average temperature, rainfall and sunshine in Omura — and find the best time to visit.
Monthly Temperature in Omura
In Omura, temperatures differ significantly between summer and winter months. On average, daytime temperatures range from a very warm 31°C (88°F) in August to a chilly 11°C (52°F) in January.
Nighttime temperatures range from 26°C (79°F) in August to 6°C (43°F) in January.
Check out our detailed temperature page for more information.
Temperature ranges by month
Rainfall in Omura
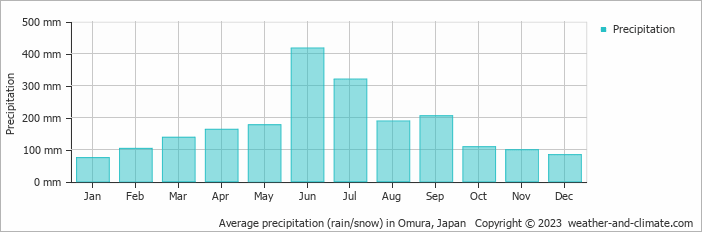
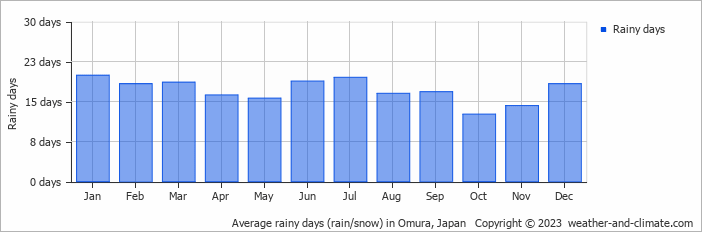
Omura experiences significant rainfall throughout the year, averaging 2074 mm (82 in) of precipitation annually. The seasons in Omura bring significant changes in precipitation. The wettest month, June, receives heavy rainfall, with an average of 417 mm (16 in) of precipitation. This rainfall is distributed across 19 rainy days.
In contrast, the driest month, January, experiences much less rainfall, totaling 74 mm (2.9 in) over 20 rainy days. These distinct seasonal differences provide diverse experiences throughout the year. For more details, please visit our Omura Precipitation page.
The mean monthly precipitation over the year, including rain, hail, and snow
The average number of days each month with precipitation
Sunshine Hours in Omura
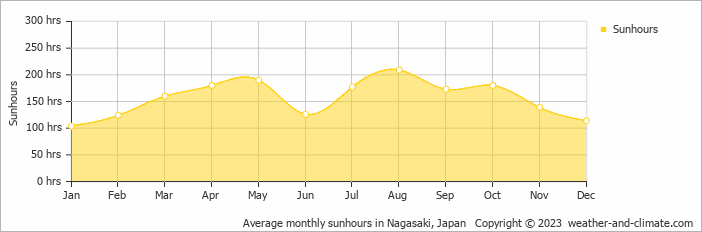
In Omura, summer days are longer and more sunny, with daily sunshine hours peaking at 7.0 hours in August. As the darker season arrives, the brightness of the sun becomes less. January sees a soft sun for only 3.5 hours per average day.
Visit our detailed sunshine hours page for more information.
Monthly hours of sunshine
Daily hours of sunshine
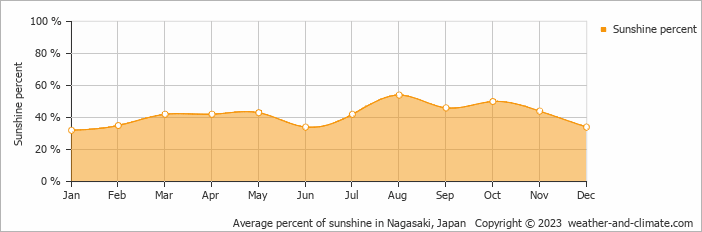
Daily percentage of sunshine
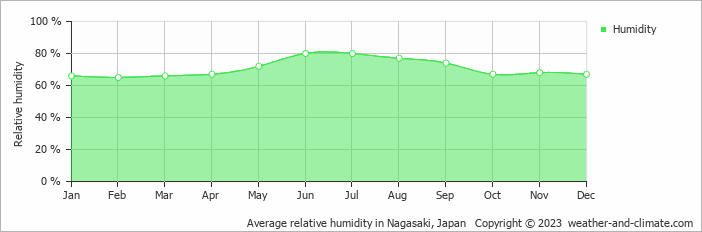
Humidity in Omura by Month
The relative humidity is high throughout the year in Omura.
The city experiences its highest humidity in June, reaching 80%. In February, the humidity drops to its lowest level at 65%. What does this mean? Read our detailed page on humidity levels for further details.
Relative humidity over the year
Best Time to Visit Omura
Be prepared for heavier rainfall during April, May, June, July, August and September, the wettest period of the year. Seeking the perfect travel destination for this year? We've created a tool that suggests locations matching your desired weather. Let our weather planner guide your travel decisions.
Frequently asked questions about the climate in Omura
What is the best time to visit Omura?
May, October and November typically offer the most optimal weather in Omura. In contrast, February, June, July and August tend to have less optimal conditions. Omura has a distinct rainy season from May to September.
What temperatures can I expect in Omura?
Daytime highs range from 11°C (52°F) in January to 31°C (88°F) in August. Nighttime lows range from 6°C (43°F) to 26°C (79°F). Temperatures vary considerably through the year.
How much rain does Omura get?
Annual rainfall is around 2074 mm (82 in). June is the wettest month with 417 mm (16 in), while January is the driest with 74 mm (2.9 in).
How sunny is Omura?
Omura receives around 1,876 hours of sunshine per year. August is the sunniest month with 209 hours, while January is the cloudiest with just 104 hours.
Omura 3-Day Forecast
Omura 3-Day Forecast
Omura on the map
Omura is highlighted — select any city to see its climate.
Popular this month
Where to go in July — average daytime high across popular destinations.
Bucket list
Need travel inspiration? Check out our bucket list articles and be inspired.
 Chase the autumn leaves in Japan
Japan is one of these cases which turns into a gold, yellow and orange fairy tale starting from September. And we can honestly say: We cannot imagine a more beautiful season to visit Japan.
Walk the 88 temple circuit
We recommend walking the 88 temple circuit from April til October. Although June, July and August can be a bit wet, hot and humid.
The famous bamboo forests of Arashiyama
The famous bamboo forests of Arashiyama lie just outside the city center of Kyoto and is unique in the world. If you look at photos of this bamboo forest, it looks like you have landed in a fairy-tale world.
10 reasons why you should visit Japan in winter
Here are 10 reasons why you should plan a winter trip to Japan. During this period, popular sights are less busy and prices for flights and hotels much cheaper.