Noril'sk Weather & Climate: Best Time to Visit
Average temperatures, rainfall, sunshine and the best time to visit Noril'sk.
Climate overview of Noril'sk
Temperatures in Noril'sk, Krasnoyarsk Krai, Russia, vary greatly throughout the year. July is the hottest month at 18°C (64°F), while January is the coldest at -23°C (-9°F).
Annual rain/snowfall is moderate at around 796 mm (31 in), with August being the wettest month. The city also has pleasant summers and very cold winters.
Noril'sk Weather by Month
Pick a month to see the average temperature, rainfall and sunshine in Noril'sk - and find the best time to visit.
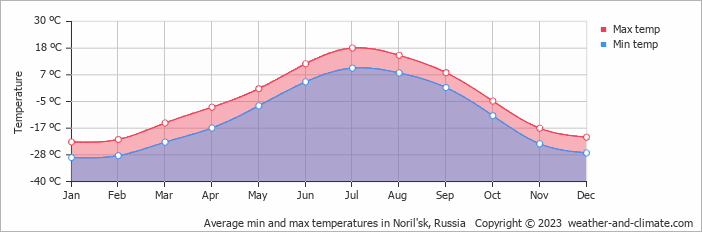
Monthly Temperature in Noril'sk
The climate in Noril'sk is known for significant temperature differences throughout the year, making the weather dynamic. Average daytime temperatures reach a pleasant 18°C (64°F) in July. In January, the coolest month of the year, temperatures drop to a very cold -23°C (-9°F).
At night, temperatures range from around 10°C (50°F) in July to -30°C (-22°F) in January.
Check out our detailed temperature page for more information.
Temperature ranges by month
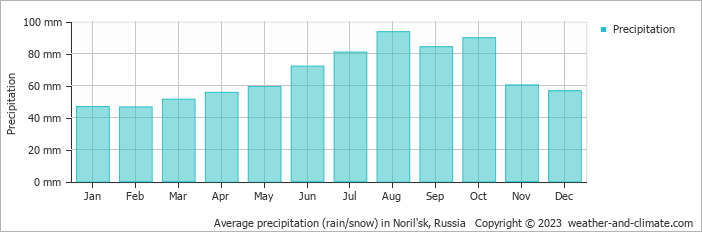
Rainfall in Noril'sk
Generally, Noril'sk receives mid-range precipitation levels, with 796 mm (31 in) annually. Noril'sk experiences moderate seasonal variation in rainfall, with monthly averages ranging from 94 mm (3.7 in) in August, the wettest month, and 47 mm (1.9 in) in February, the driest month. For more details, please visit our Noril'sk Precipitation page.
The mean monthly precipitation over the year, including rain, hail, and snow
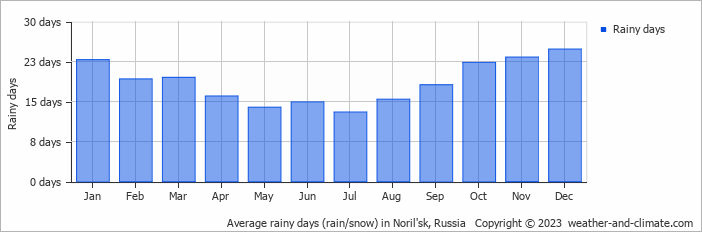
The average number of days each month with precipitation
Best Time to Visit Noril'sk
Monthly ratings reflect general weather comfort, based on daytime temperature and rainfall. Swimming and winter conditions are highlighted separately where relevant.
- Best overall: July
- Warmest weather: July
- Fewer rainy days: April, May, June, July and August
- Seasonal pattern: Pleasant summers and very cold winters
- Coldest conditions: January, with freezing nights around -30°C (-22°F).
Frequently asked questions about the climate in Noril'sk
What is the best time to visit Noril'sk?
July typically offers the most optimal weather in Noril'sk. In contrast, January, February, March, April, May, September, October, November and December tend to have less optimal conditions. Noril'sk has pleasant summers and very cold winters.
What temperatures can I expect in Noril'sk?
Daytime highs range from -23°C (-9°F) in January to 18°C (64°F) in July. Nighttime lows range from -30°C (-22°F) to 10°C (50°F). Temperatures vary considerably through the year.
How much rain does Noril'sk get?
Annual rainfall is around 796 mm (31 in). August is the wettest month with 94 mm (3.7 in), while February is the driest with 47 mm (1.9 in).
Noril'sk 3-Day Forecast
Noril'sk 3-Day Forecast
Noril'sk on the map
Noril'sk is highlighted - select any city to see its climate.
Popular this month
Where to go in July - average daytime high across popular destinations.
Bucket list
Need travel inspiration? Check out our bucket list articles and be inspired.
 Visit the Kamchatka Peninsula
One of the most enchanting areas of Russia is the Kamchatka peninsula. It is how the earth must have looked like in prehistoric times.
Be amazed by the Altai mountains
The Atlai mountains are a sparsely populated area that most tourists have not yet discovered. Definitely bucket list material for the adventurous travelers among us.