Mosjøen Weather & Climate: Best Time to Visit
Average temperatures, rainfall, sunshine and the best time to visit Mosjøen.
Climate overview of Mosjøen
The climate in Mosjøen, Nordland, Norway, is marked by large temperature swings across the seasons, ranging from 18°C (64°F) in July to -2°C (28°F) in February.
Rain/snowfall is high, totalling around 1928 mm (76 in) per year. January is the wettest month and May the driest. The city also experiences a distinct rainy season from December to March.
Mosjøen Weather by Month
Pick a month to see the average temperature, rainfall and sunshine in Mosjøen — and find the best time to visit.
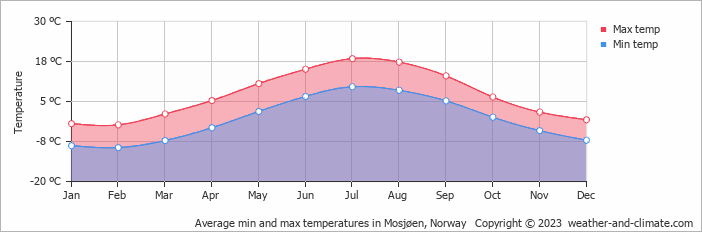
Monthly Temperature in Mosjøen
In Mosjøen, temperatures differ significantly between summer and winter months. Average maximum daytime temperatures range from a pleasant 18°C (64°F) in July, the warmest time of the year, to a very cold -2°C (28°F) during cooler months like February.
At night, you can expect temperatures ranging from 10°C (50°F) in July to around -9°C (16°F) during February.
Check out our detailed temperature page for more information.
Temperature ranges by month
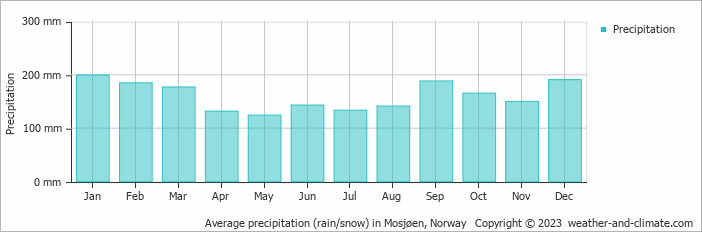
Rainfall in Mosjøen
Mosjøen experiences significant rain/snowfall throughout the year, averaging 1928 mm (76 in) of precipitation annually. Year-round, Mosjøen has a balanced climate with minimal variation in precipitation. The difference between the wettest month, January, with 199 mm (7.8 in), and the driest month, May, with 124 mm (4.9 in), is minimal. For more details, please visit our Mosjøen Precipitation page.
The mean monthly precipitation over the year, including rain, hail, and snow
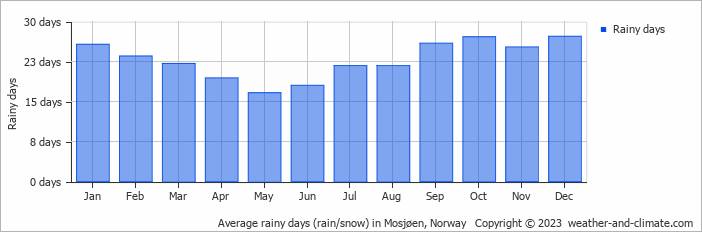
The average number of days each month with precipitation
Best Time to Visit Mosjøen
Be prepared for heavier rainfall during January, February, March, September, October and December, the wettest period of the year. Looking for inspiration on where to travel this year? We have a tool that recommends destinations based on your ideal conditions. Find out where to go with our weather planner.
Frequently asked questions about the climate in Mosjøen
What is the best time to visit Mosjøen?
July typically offers the most optimal weather in Mosjøen. In contrast, January, February, March, April, May, September, October, November and December tend to have less optimal conditions. Mosjøen has a distinct rainy season from December to March.
What temperatures can I expect in Mosjøen?
Daytime highs range from -2°C (28°F) in February to 18°C (64°F) in July. Nighttime lows range from -9°C (16°F) to 10°C (50°F). Temperatures vary considerably through the year.
How much rain does Mosjøen get?
Annual rainfall is around 1928 mm (76 in). January is the wettest month with 199 mm (7.8 in), while May is the driest with 124 mm (4.9 in). In the coldest months, precipitation may fall as snow.
Mosjøen 3-Day Forecast
Mosjøen 3-Day Forecast
Mosjøen on the map
Mosjøen is highlighted — select any city to see its climate.
Popular this month
Where to go in July — average daytime high across popular destinations.
Bucket list
Need travel inspiration? Check out our bucket list articles and be inspired.
 The rugged landscape of the Norwegian fjords
This landscape is rated as the most beautiful in the world and it is something you need to experience at least once in your life.
Discover Norway's Hidden Gem: The Littleisland Lighthouse
Explore Littleisland Lighthouse in Norway - a serene getaway offering unique stays, breathtaking views, and a journey into tranquil simplicity.
The Majestic Geirangerfjord: Norway's Crown Jewel
Explore Norway's stunning Geirangerfjord, famous for its dramatic cliffs, waterfalls, and scenic routes. Breathtaking landscapes and outdoor adventures
Swimming with orcas in Norway
The best travel period to travel to Norway for the orcas are the months October, November December, January and February. Swimming with orcas in Norway might be the bucket list trip of your life.