Mollens Weather & Climate: Best Time to Visit
Average temperatures, rainfall, sunshine and the best time to visit Mollens.
Climate overview of Mollens
Temperatures in Mollens, Canton of Valais, Switzerland, vary greatly throughout the year. July is the hottest month at 19°C (66°F), while January is the coldest at -4°C (25°F).
The city receives considerable rain/snowfall, with around 1625 mm (64 in) annually. June is the wettest month. July is the sunniest month, averaging 9.0 hours of sunshine per day.
Mollens Weather by Month
Pick a month to see the average temperature, rainfall and sunshine in Mollens — and find the best time to visit.
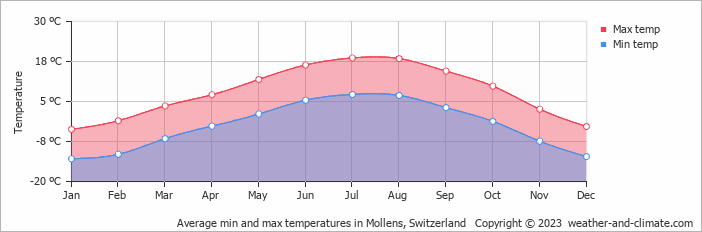
Monthly Temperature in Mollens
The climate in Mollens is known for significant temperature differences throughout the year, making the weather dynamic. Typically, average maximum daytime temperatures range from a pleasant 19°C (66°F) in July to a very cold -4°C (25°F) in the coolest month, January.
Nights vary from 7°C (45°F) in July to around -13°C (9°F) during the colder months.
Check out our detailed temperature page for more information.
Temperature ranges by month
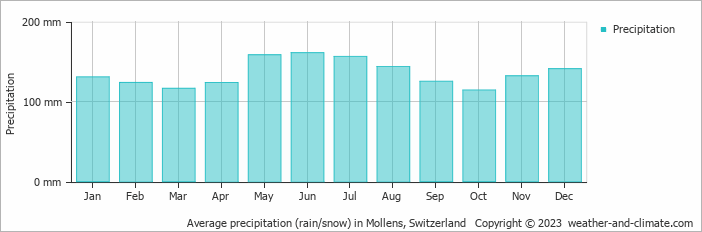
Rainfall in Mollens
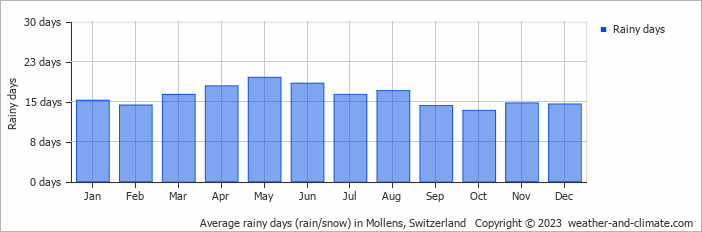
Mollens has a notably wet climate with abundant precipitation, recording 1625 mm (64 in) of rain/snowfall per year. Precipitation levels in Mollens remain relatively steady throughout the year. June has the most rain, with 161 mm (6.3 in) over 18 days. In the driest month October, this drops slightly to 114 mm (4.5 in), making the city's climate fairly predictable. For more details, please visit our Mollens Precipitation page.
The mean monthly precipitation over the year, including rain, hail, and snow
The average number of days each month with precipitation
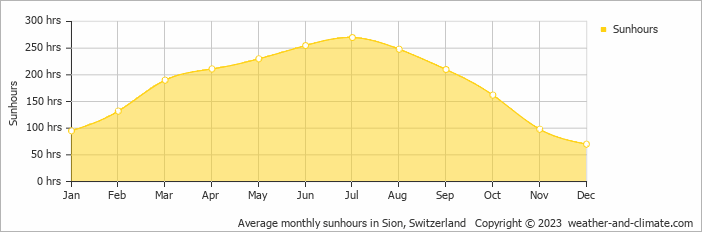
Sunshine Hours in Mollens
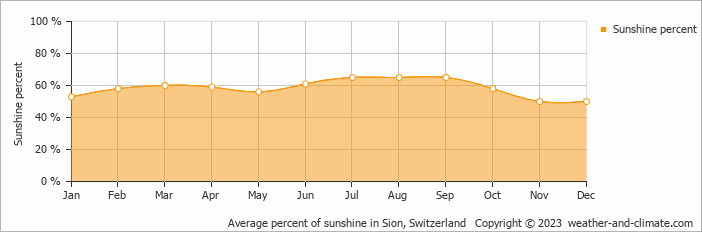
For those who appreciate different seasons, Mollens serves as an ideal destination. Expect longer, more sun-filled days in July with an average of 9.0 hours of sunshine daily, and embrace the darker days in December, offering only 2.3 hours of daily sunlight.
Visit our detailed sunshine hours page for more information.
Monthly hours of sunshine
Daily hours of sunshine
Daily percentage of sunshine
Humidity in Mollens by Month
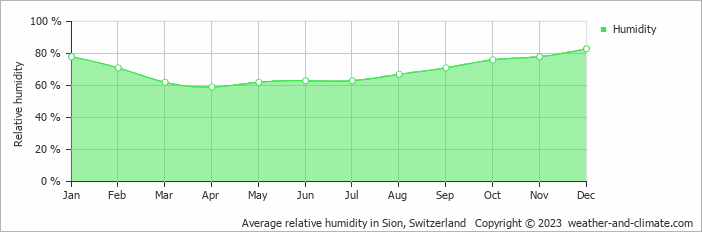
The relative humidity is high throughout the year in Mollens.
The city experiences its highest humidity in December, reaching 83%. In April, the humidity drops to its lowest level at 59%. What does this mean? Read our detailed page on humidity levels for further details.
Relative humidity over the year
Wind Speed in Mollens
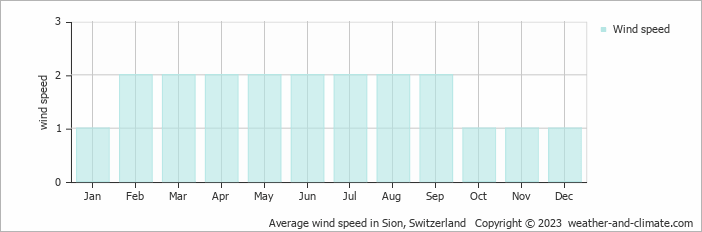
The mean wind speed varies between 1 m/s (2 knots) and 2 m/s (4 knots) throughout the year. It is lowest in January, October, November and December and highest during February, March, April, May, June, July, August and September. What does this mean?
The mean monthly wind speed over the year (meters per second)
Best Time to Visit Mollens
The wettest months are June, when precipitation is at its highest. Planning your next adventure but unsure where to go? Our climate tool suggests perfect locations tailored to your preferred weather conditions. Discover your ideal travel destination with our weather planner.
Frequently asked questions about the climate in Mollens
What is the best time to visit Mollens?
July and August typically offer the most optimal weather in Mollens. In contrast, January, February, March, April, May, October, November and December tend to have less optimal conditions.
What temperatures can I expect in Mollens?
Daytime highs range from -4°C (25°F) in January to 19°C (66°F) in July. Nighttime lows range from -13°C (9°F) to 7°C (45°F). Temperatures vary considerably through the year.
How much rain does Mollens get?
Annual rainfall is around 1625 mm (64 in). June is the wettest month with 161 mm (6.3 in), while October is the driest with 114 mm (4.5 in).
How sunny is Mollens?
Mollens receives around 2,171 hours of sunshine per year. July is the sunniest month with 270 hours, while December is the cloudiest with just 70 hours. Overall, Mollens enjoys abundant sunshine.
Mollens 3-Day Forecast
Mollens 3-Day Forecast
Mollens on the map
Mollens is highlighted — select any city to see its climate.
Popular this month
Where to go in July — average daytime high across popular destinations.
Bucket list
Need travel inspiration? Check out our bucket list articles and be inspired.
 The 5 most scenic train journeys in Switzerland
Explore Switzerland's top 5 train journeys, featuring breathtaking Alpine views and engineering marvels like the Glacier Express and Bernina Express.
You'll love this Mountain roller coaster
Hotel Oeschinensee’s mountain coaster is a summer toboggan that you want to add to your bucket list. You'll get in your cart, sit down and fly across the track while enjoying the beautiful mountain scenery around you.
The Verzasca Valley
You can visit the Verzasca Valley in any season. It's an amazing place for swimming and it is a paradise for hikers. A must see for the bucket list.
Balloon at Chateau D'oex
If you are looking for a special place to visit in Europe in January we recommend visiting the annual balloon festival in Château-d'Oex, Switzerland.