Mirsk Weather & Climate: Best Time to Visit
Average temperatures, rainfall, sunshine and the best time to visit Mirsk.
Climate overview of Mirsk
Mirsk, Lower Silesia, Poland, experiences significant temperature variation throughout the year. Summers bring daytime highs of 23°C (73°F) in July, while winters cool to 2°C (36°F) in January.
The city has a wet climate, receiving around 1022 mm (40 in) of rain/snowfall per year. July is the wettest month. Sunshine peaks in July, when the city sees around 7.9 hours of sunshine per day.
Mirsk Weather by Month
Pick a month to see the average temperature, rainfall and sunshine in Mirsk — and find the best time to visit.
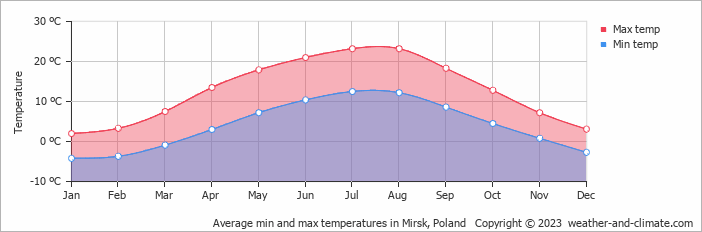
Monthly Temperature in Mirsk
Depending on the time of the year, temperatures range from comfortable to chilly in Mirsk. On average, daytime temperatures range from a comfortable 23°C (73°F) in July to a chilly 2°C (36°F) in January.
Nighttime temperatures range from 13°C (55°F) in July to -4°C (25°F) in January.
Check out our detailed temperature page for more information.
Temperature ranges by month
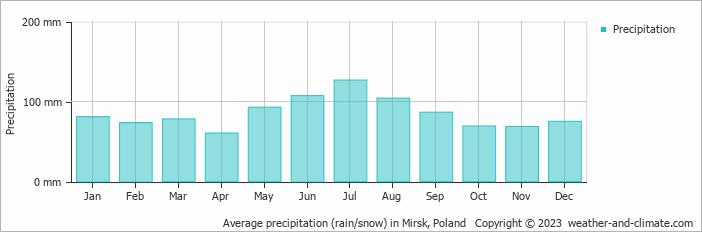
Rainfall in Mirsk
Mirsk has a relatively rain/snowy climate with high precipitation levels, averaging 1022 mm (40 in) of rain/snowfall annually. The amount of precipitation varies moderately throughout the year. The wettest month, July, sees around 127 mm (5 in) of rainfall, perfect for those who enjoy a bit of rain now and then. The driest month, April, still receives a respectable 60 mm (2.4 in) of rainfall. For more details, please visit our Mirsk Precipitation page.
The mean monthly precipitation over the year, including rain, hail, and snow
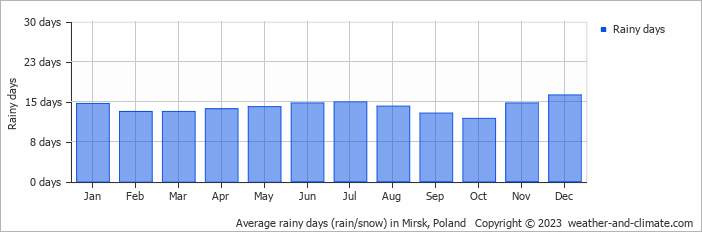
The average number of days each month with precipitation
Sunshine Hours in Mirsk
In Mirsk, summer days are longer and more sunny, with daily sunshine hours peaking at 7.9 hours in July. As the darker season arrives, the brightness of the sun becomes less. December sees a soft sun for only 2.2 hours per average day.
Visit our detailed sunshine hours page for more information.
Monthly hours of sunshine
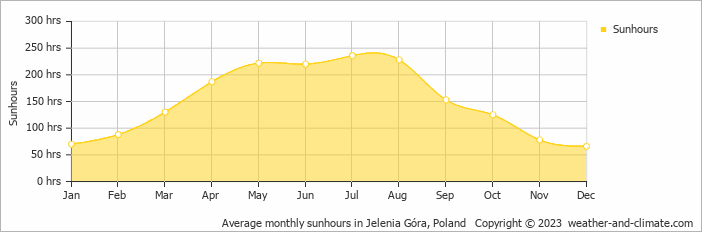
Daily hours of sunshine
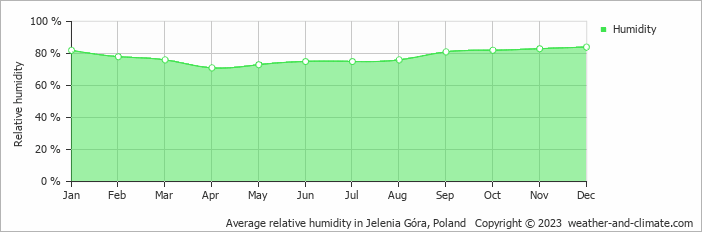
Humidity in Mirsk by Month
The relative humidity is high throughout the year in Mirsk.
The city experiences its highest humidity in December, reaching 84%. In April, the humidity drops to its lowest level at 71%. What does this mean? Read our detailed page on humidity levels for further details.
Relative humidity over the year
Best Time to Visit Mirsk
Rainfall during this time ranges from 86 mm (3.4 in) in September to 127 mm (5 in) in July. This means you can expect a mix of sunny days and occasional showers. Seeking the perfect travel destination for this year? We've created a tool that suggests locations matching your desired weather. Let our weather planner guide your travel decisions.
Frequently asked questions about the climate in Mirsk
What is the best time to visit Mirsk?
May, June, July, August and September typically offer the most optimal weather in Mirsk. In contrast, January, February, March, November and December tend to have less optimal conditions.
What temperatures can I expect in Mirsk?
Daytime highs range from 2°C (36°F) in January to 23°C (73°F) in July. Nighttime lows range from -4°C (25°F) to 13°C (55°F). Temperatures vary considerably through the year.
How much rain does Mirsk get?
Annual rainfall is around 1022 mm (40 in). July is the wettest month with 127 mm (5 in), while April is the driest with 60 mm (2.4 in).
How sunny is Mirsk?
Mirsk receives around 1,803 hours of sunshine per year. July is the sunniest month with 236 hours, while December is the cloudiest with just 66 hours.
Mirsk 3-Day Forecast
Mirsk 3-Day Forecast
Mirsk on the map
Mirsk is highlighted — select any city to see its climate.
Popular this month
Where to go in July — average daytime high across popular destinations.
Bucket list
Need travel inspiration? Check out our bucket list articles and be inspired.
 7 of the most budget-friendly destinations in Europe
Discover Europe's top budget-friendly destinations including Budapest, Kotor, Krakow, and more, perfect for affordable and exciting travel.
 Bialowieza, the Last Primeval Forest
Being the last remaining segment of the once sprawling lowland forest that covered Europe, Bialowieza stands as the final stronghold of true wilderness on the continent.