Melenara Weather and Climate: A Comprehensive Guide
The weather in Melenara is characterized by a steady average temperature throughout the year.
The area is known for its low rainfall.
Let's now guide you through the climate details for a complete overview.
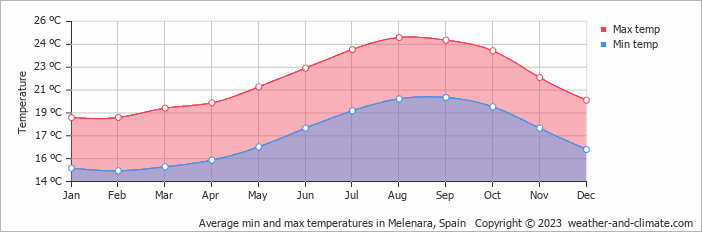
Average maximum day and minimum night temperature
The temperature in Melenara remains steady throughout the year, providing a consistently comfortable climate. Average maximum daytime temperatures range from a comfortable 25°C in August, the warmest time of the year, to a pleasant 19°C during cooler months like February.
At night, temperatures typically drop to an average of around 15°C during these months. Check out our detailed temperature page for more information.Temperature ranges by month
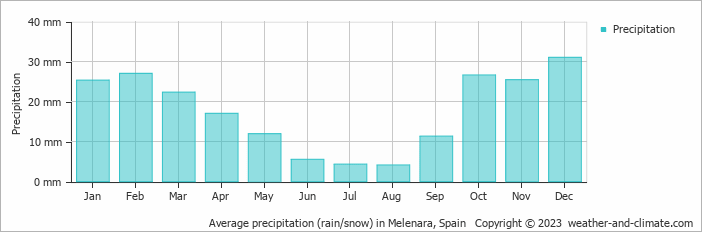
Precipitation and rainy days
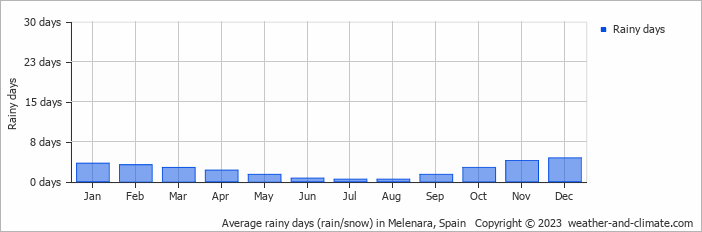
Melenara has a dry climate with very low precipitation, averaging 212 mm of rainfall annually. Significant seasonal changes in precipitation occur throughout the year. During the wetter season, December receives moderate rainfall, averaging 31 mm of precipitation, recorded across 4 rainy days. In contrast, the drier season, August brings less rainfall, with 4.1 mm over 0 rainy days. For more details, please visit our Melenara Precipitation page.The mean monthly precipitation over the year, including rain, hail and snow
The average number of days each month with precipitation
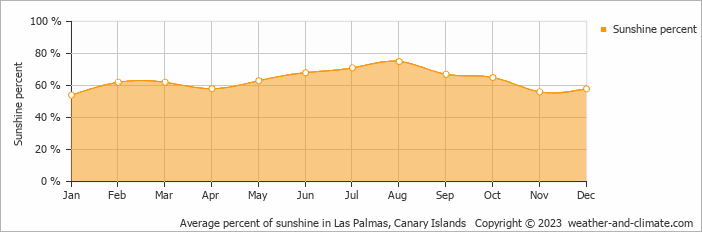
Sunshine over the year
Seasonal changes in sunshine hours are quite dramatic in Melenara. While July receives considerable daily sunshine with up to 10.4 hours, December marks the darkest time of the year, where sunshine is scarce with only 5.9 hours of sunlight per day. Visit our detailed sunshine hours page for more information.Monthly hours of sunshine
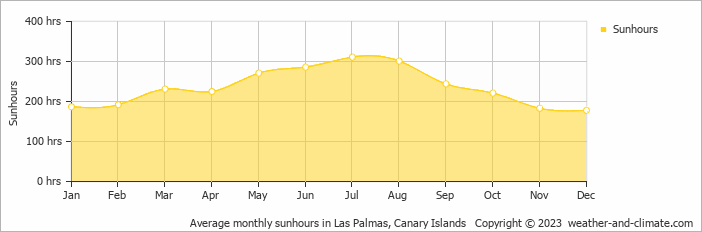
Daily hours of sunshine
Daily percentage of sunshine
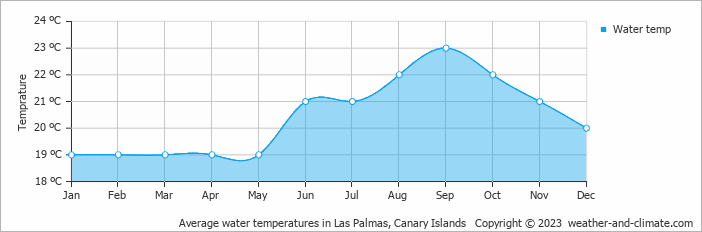
Average water temperature
The mean water temperature over the year ranges from 19°C in January to 23°C in September.
Water temperature over the year
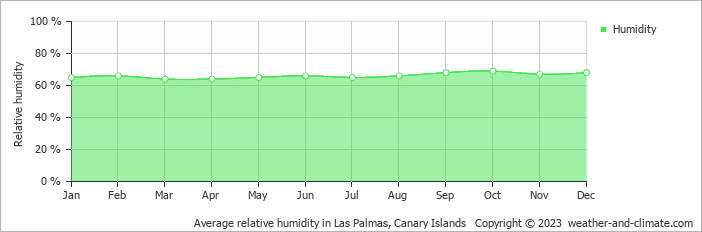
Average humidity
The relative humidity is high throughout the year in Melenara.
The city experiences its highest humidity in October, reaching 69%. In March, the humidity drops to its lowest level at 64%. Explore our detailed page on humidity levels for further details.
Relative humidity over the year
partly cloudy and chance of rain partly cloudy and thunder clear and no rainForecast for Melenara
 8 m/s
8 m/s![]() 5 m/s
5 m/s![]() 4 m/s
4 m/s![]()
The best time of year to visit Melenara in Spain
During the months of May, June, July, August, September, October, November and December you are most likely to experience good weather with pleasant average temperatures that fall between 20°C and 26°C.Other facts from our historical weather data:
Yes, the months of April, May, June, July, August and September are very dry.
August has an average maximum temperature of 25°C and is the warmest month of the year.
The coldest month is February with an average maximum temperature of 19°C.
December tops the wettest month list with 31 mm of rainfall.
August is the driest month with 4 mm of precipitation.
July is the sunniest month with an average of 311 hours of sunshine.
No idea where to travel to this year? We have a tool that recommends destinations based on your ideal conditions. Find out where to go with our weather planner.


