Lyngså Weather & Climate: Best Time to Visit
Average temperatures, rainfall, sunshine and the best time to visit Lyngså.
Climate overview of Lyngså
Lyngså, Denmark, experiences significant temperature variation throughout the year. Summers bring daytime highs of 20°C (68°F) in August, while winters cool to 5°C (41°F) in February.
Lyngså sees a moderate amount of rain/snowfall, totalling around 853 mm (34 in) per year. The most sunshine falls in June, with an average of 9.1 hours of daily sunshine.
Lyngså Weather by Month
Pick a month to see the average temperature, rainfall and sunshine in Lyngså — and find the best time to visit.
Monthly Temperature in Lyngså
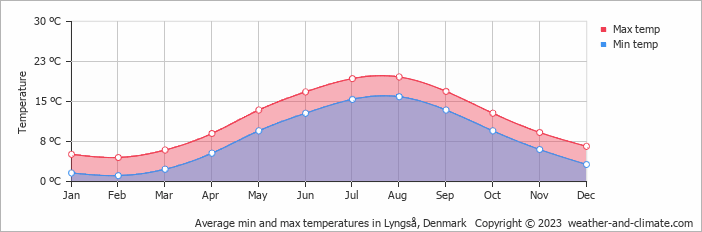
Depending on the time of the year, temperatures range from pleasant to chilly in Lyngså. Average maximum daytime temperatures range from a pleasant 20°C (68°F) in August, the warmest time of the year, to a chilly 5°C (41°F) during cooler months like February.
At night, you can expect temperatures ranging from 16°C (61°F) in August to around 1°C (34°F) during February.
Check out our detailed temperature page for more information.
Temperature ranges by month
Rainfall in Lyngså
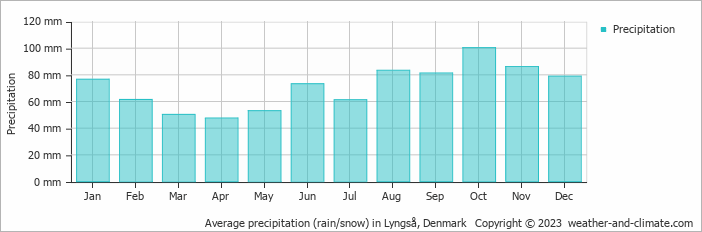
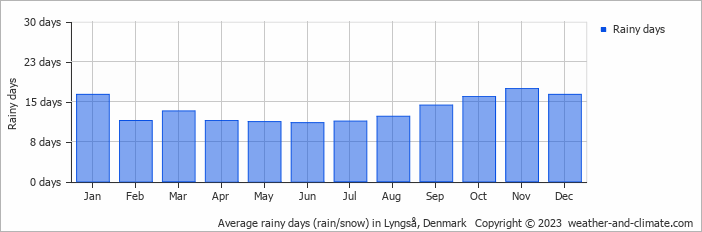
Generally, Lyngså has a moderate amount of precipitation, averaging 853 mm (34 in) of rain/snowfall annually. While rainfall varies throughout the year, each season offers its own charm. October brings wetter days averaging 100 mm (3.9 in) of precipitation, spread over 16 rainy days.
In contrast, the driest month April experiences a drier climate, with about 48 mm (1.9 in) of rainfall spread across 11 rainy days. For more details, please visit our Lyngså Precipitation page.
The mean monthly precipitation over the year, including rain, hail, and snow
The average number of days each month with precipitation
Sunshine Hours in Lyngså
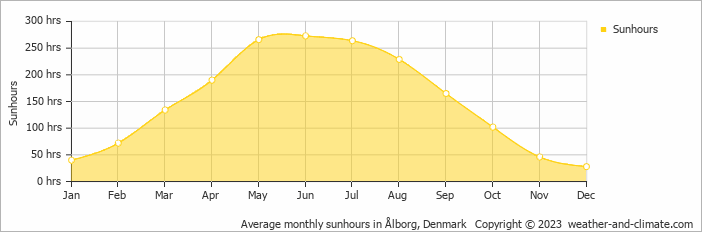
Seasonal changes in sunshine hours are quite dramatic in Lyngså. While June receives considerable daily sunshine with up to 9.1 hours, December marks the darkest time of the year, where sunshine is scarce with only 0.9 hours of sunlight per day.
Visit our detailed sunshine hours page for more information.
Monthly hours of sunshine
Daily hours of sunshine
Daily percentage of sunshine
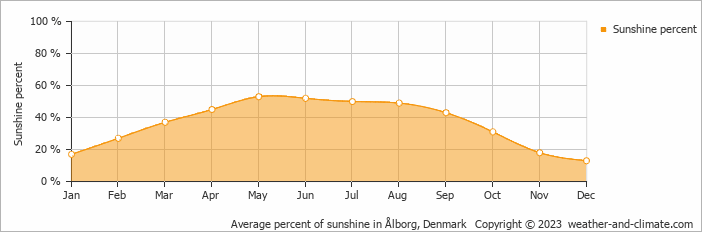
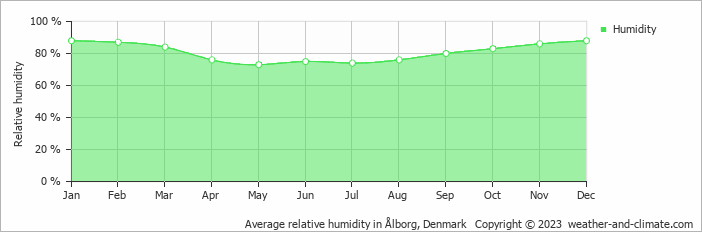
Humidity in Lyngså by Month
The city experiences its highest humidity in January, reaching 88%. In May, the humidity drops to its lowest level at 73%. What does this mean? Read our detailed page on humidity levels for further details.
Relative humidity over the year
Best Time to Visit Lyngså
Rainfall during this time ranges from 61 mm (2.4 in) in July to 83 mm (3.3 in) in August. This means you can expect a mix of sunny days and occasional showers. Looking for inspiration on where to travel this year? We have a tool that recommends destinations based on your ideal conditions. Find out where to go with our weather planner.
Frequently asked questions about the climate in Lyngså
What is the best time to visit Lyngså?
August typically offers the most optimal weather in Lyngså. In contrast, January, February, March, April, October, November and December tend to have less optimal conditions.
What temperatures can I expect in Lyngså?
Daytime highs range from 5°C (41°F) in February to 20°C (68°F) in August. Nighttime lows range from 1°C (34°F) to 16°C (61°F). Temperatures vary considerably through the year.
How much rain does Lyngså get?
Annual rainfall is around 853 mm (34 in). October is the wettest month with 100 mm (3.9 in), while April is the driest with 48 mm (1.9 in).
How sunny is Lyngså?
Lyngså receives around 1,809 hours of sunshine per year. June is the sunniest month with 273 hours, while December is the cloudiest with just 28 hours.
Lyngså 3-Day Forecast
Lyngså 3-Day Forecast
Lyngså on the map
Lyngså is highlighted — select any city to see its climate.
Popular this month
Where to go in July — average daytime high across popular destinations.